Cow Ear Sensor Clinical Test Guide
Clinical Test Data Upload Guide
Download the App
iPhone users should first install TestFlight, then download and install the Clinical Test App through TestFlight.
Add Devices and Cattle
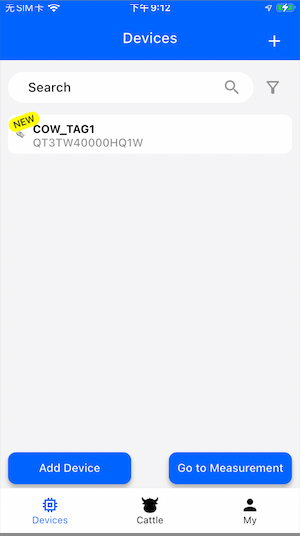
Add Devices
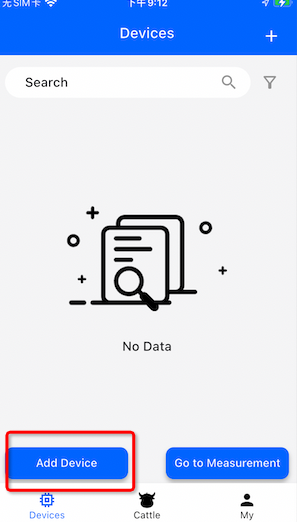
- Register and log in to the App, then go to the Devices page.
- Click Add Device to add a new device.
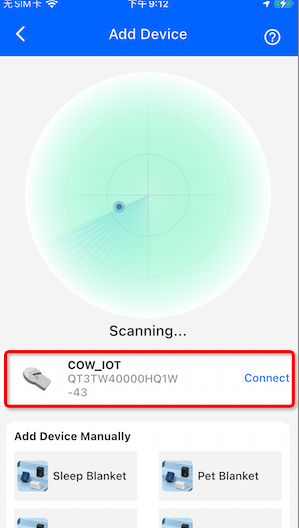
- After scanning the cow ear tag device, click Connect to connect it.
- Once connected successfully, the device will appear in the device list.
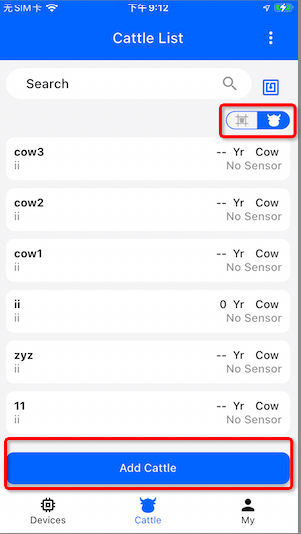
Add Cattle
- Go to the Cattle page.
- Click the barn/cattle switch icon to switch to the cattle list view.
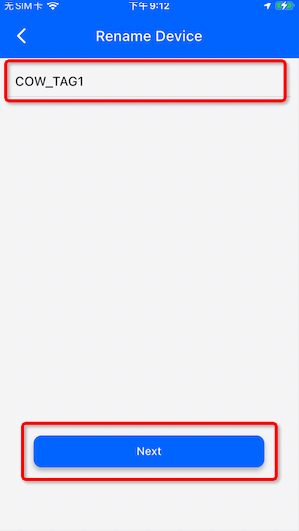
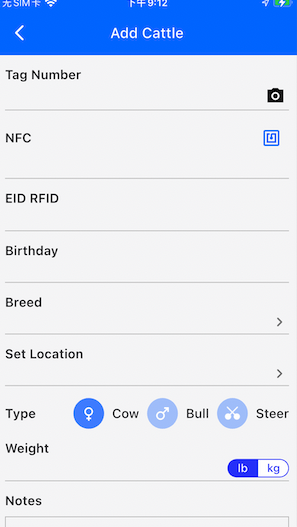
- Click Add Cattle to add a new cow.
- Fill in:
- Tag Number
- Other cattle information
- Click Save to complete the setup.
Clinical Test
Start Measurement
-
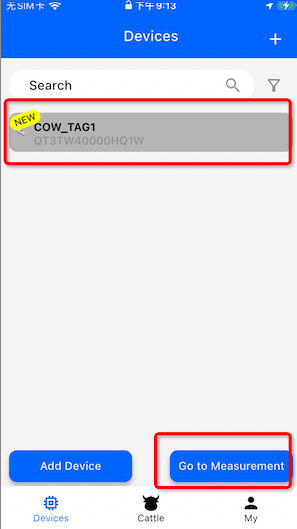
Go to the Devices page.
-
Select one or more devices.
-
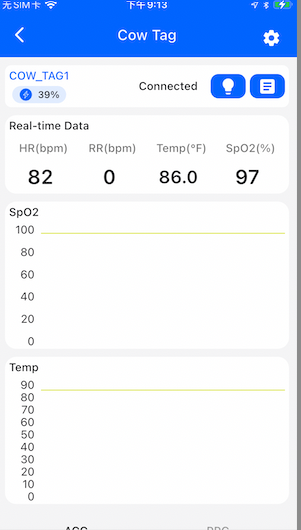
Click Go to Measurement to enter the clinical testing page.
-
On this page, you can view:
- Selected ear tag devices
- Real-time measurement waveform charts
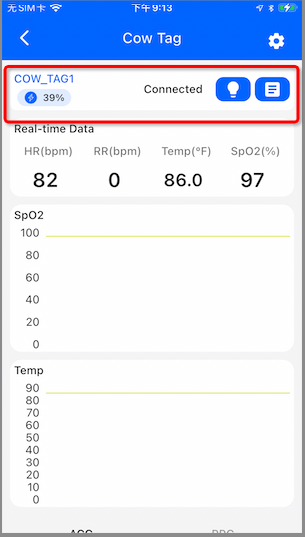
Device Features
The device list displays:
- Device Name
- Battery Level
- Connection Status
- Find Device
- Add Notes
1. Device Connection Notes
To reduce power consumption, the ear tag device broadcasts Bluetooth signals approximately every 10 seconds.
Because of this, connection attempts may occasionally fail or timeout. In this case, the device status may change from “Connecting” to “Connect”.
Click the Connect button again to search for and reconnect the device.
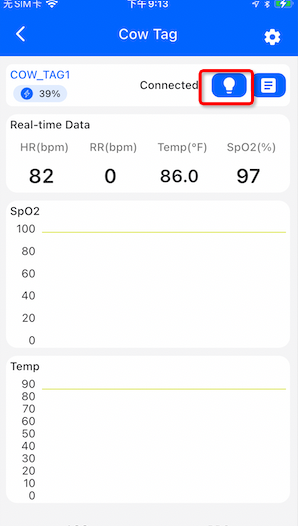
2. Find Device
If you are unable to identify which physical ear tag corresponds to the connected device, click the light bulb icon.
The ear tag LED will start flashing, allowing you to quickly locate the device.
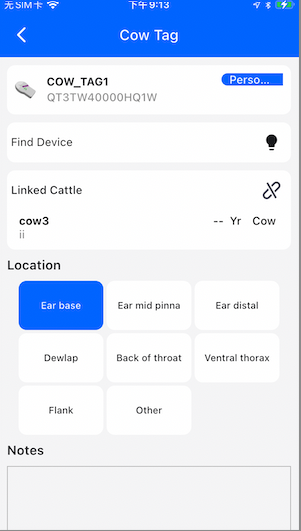
3. Add Notes and Binding Information
Click the notes button to perform the following actions:
- Find the ear tag
- Bind the ear tag to a cattle record
- Set the measurement location
- Add notes
If the required measurement location is not available in the preset list, select Other to create a custom location.
After clicking Save, the information will automatically sync to the cloud platform.
Automatic Data Upload
After the device is connected successfully, raw measurement data will automatically upload to the cloud platform.
Once a measurement session is completed, please exit the measurement page promptly, because entering the measurement page automatically creates a new clinical test record in the backend.
Clinical Test Data Viewing and Download
1. Open the Platform
Open the following website in your browser:
After logging in, you will enter the platform homepage.
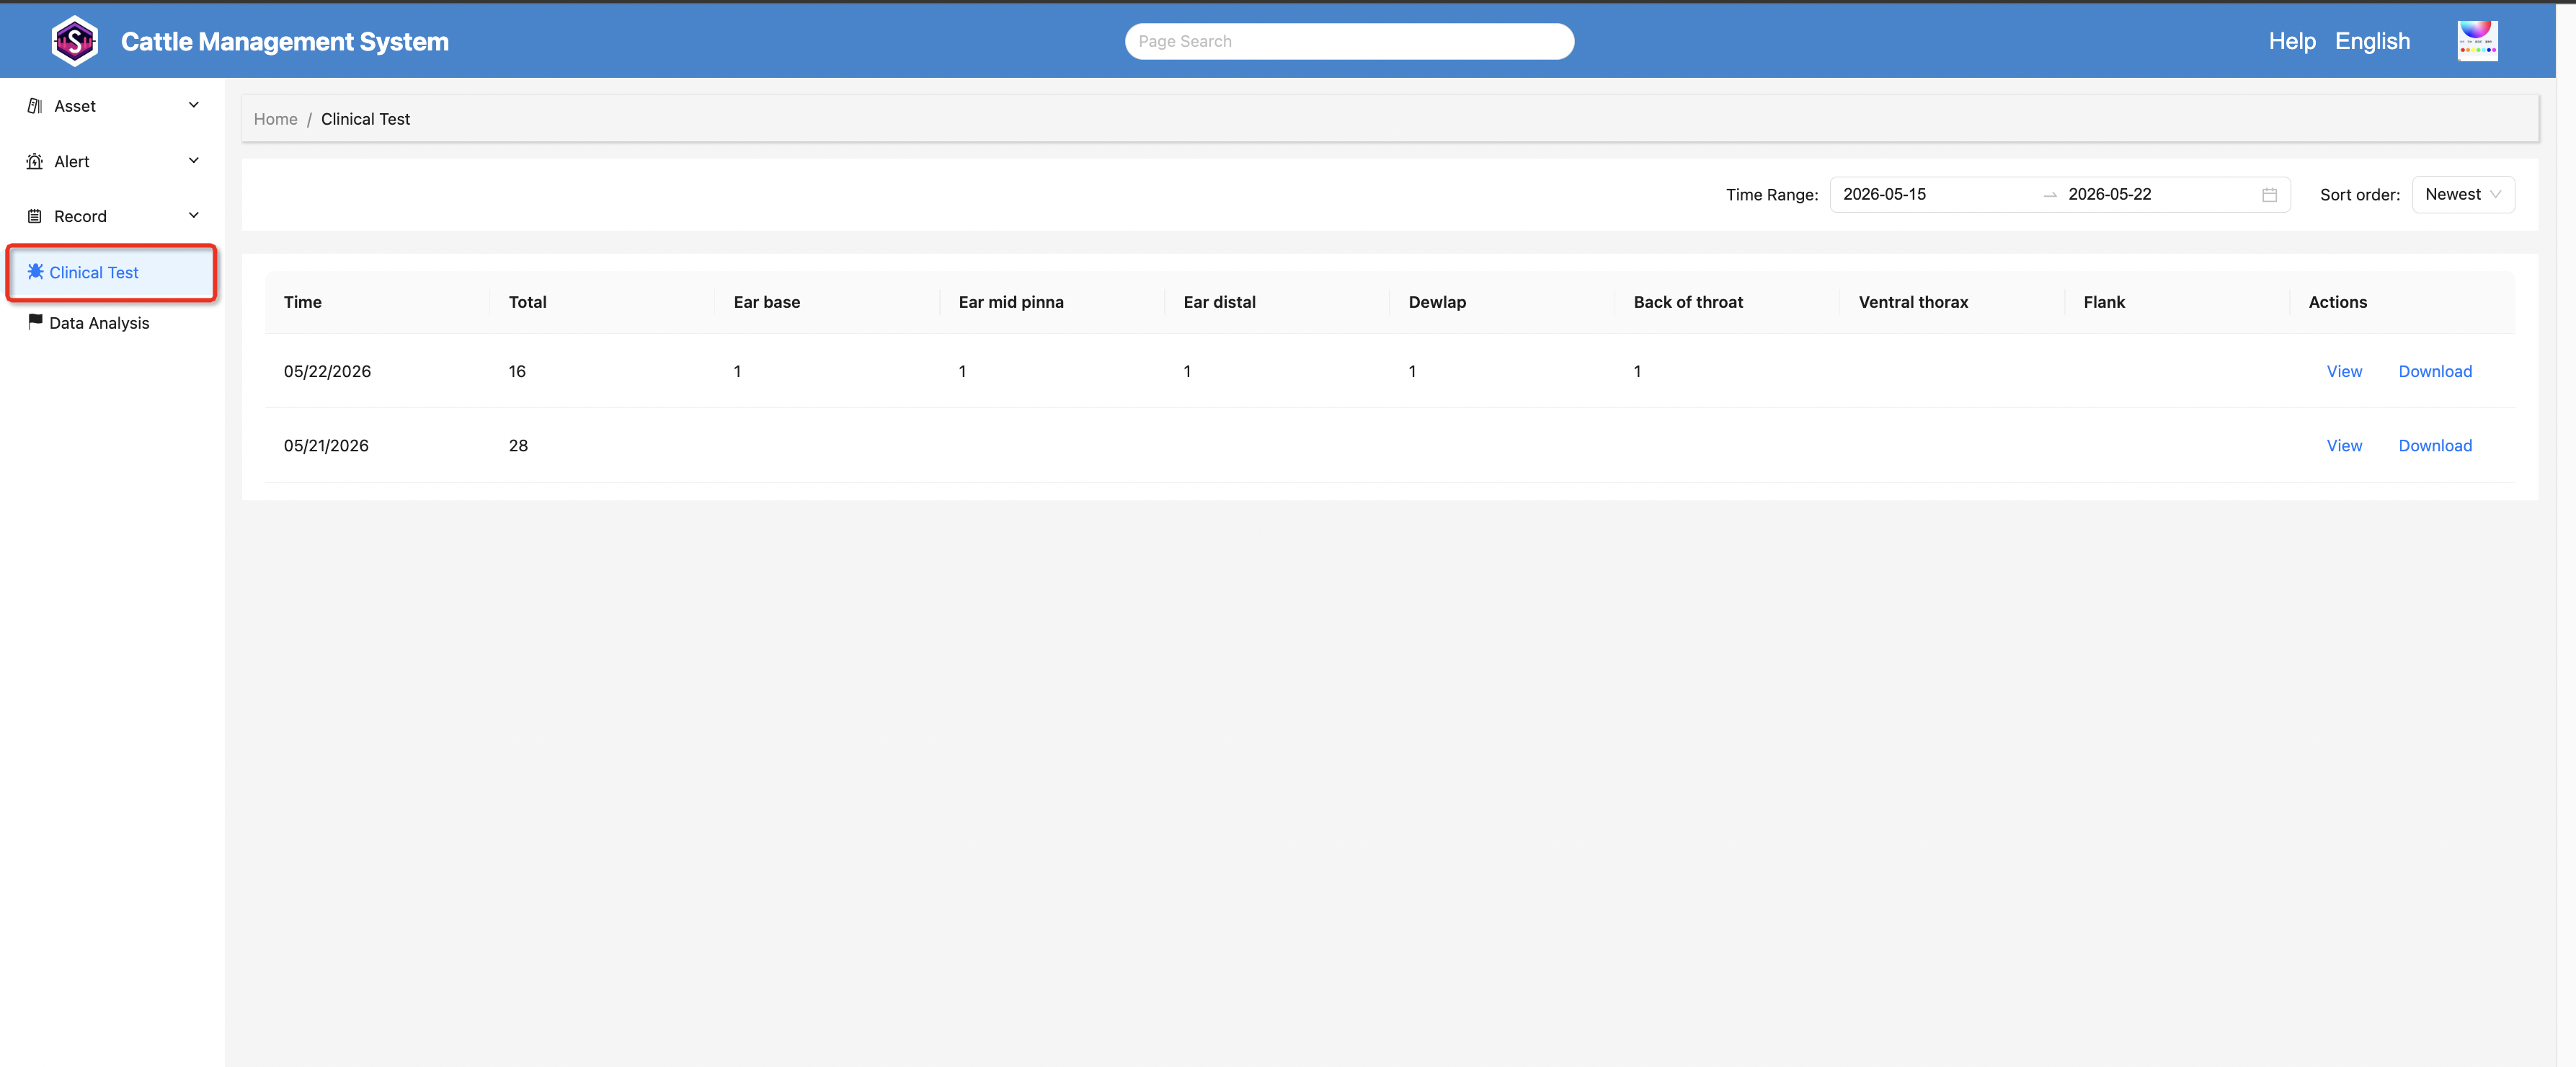
2. View Clinical Test Records
Click Clinical Test in the left-side menu to open the clinical test records page.
On this page, you can view:
- Whether data exists for a specific day
- Total amount of data collected each day
- Record counts for different measurement locations
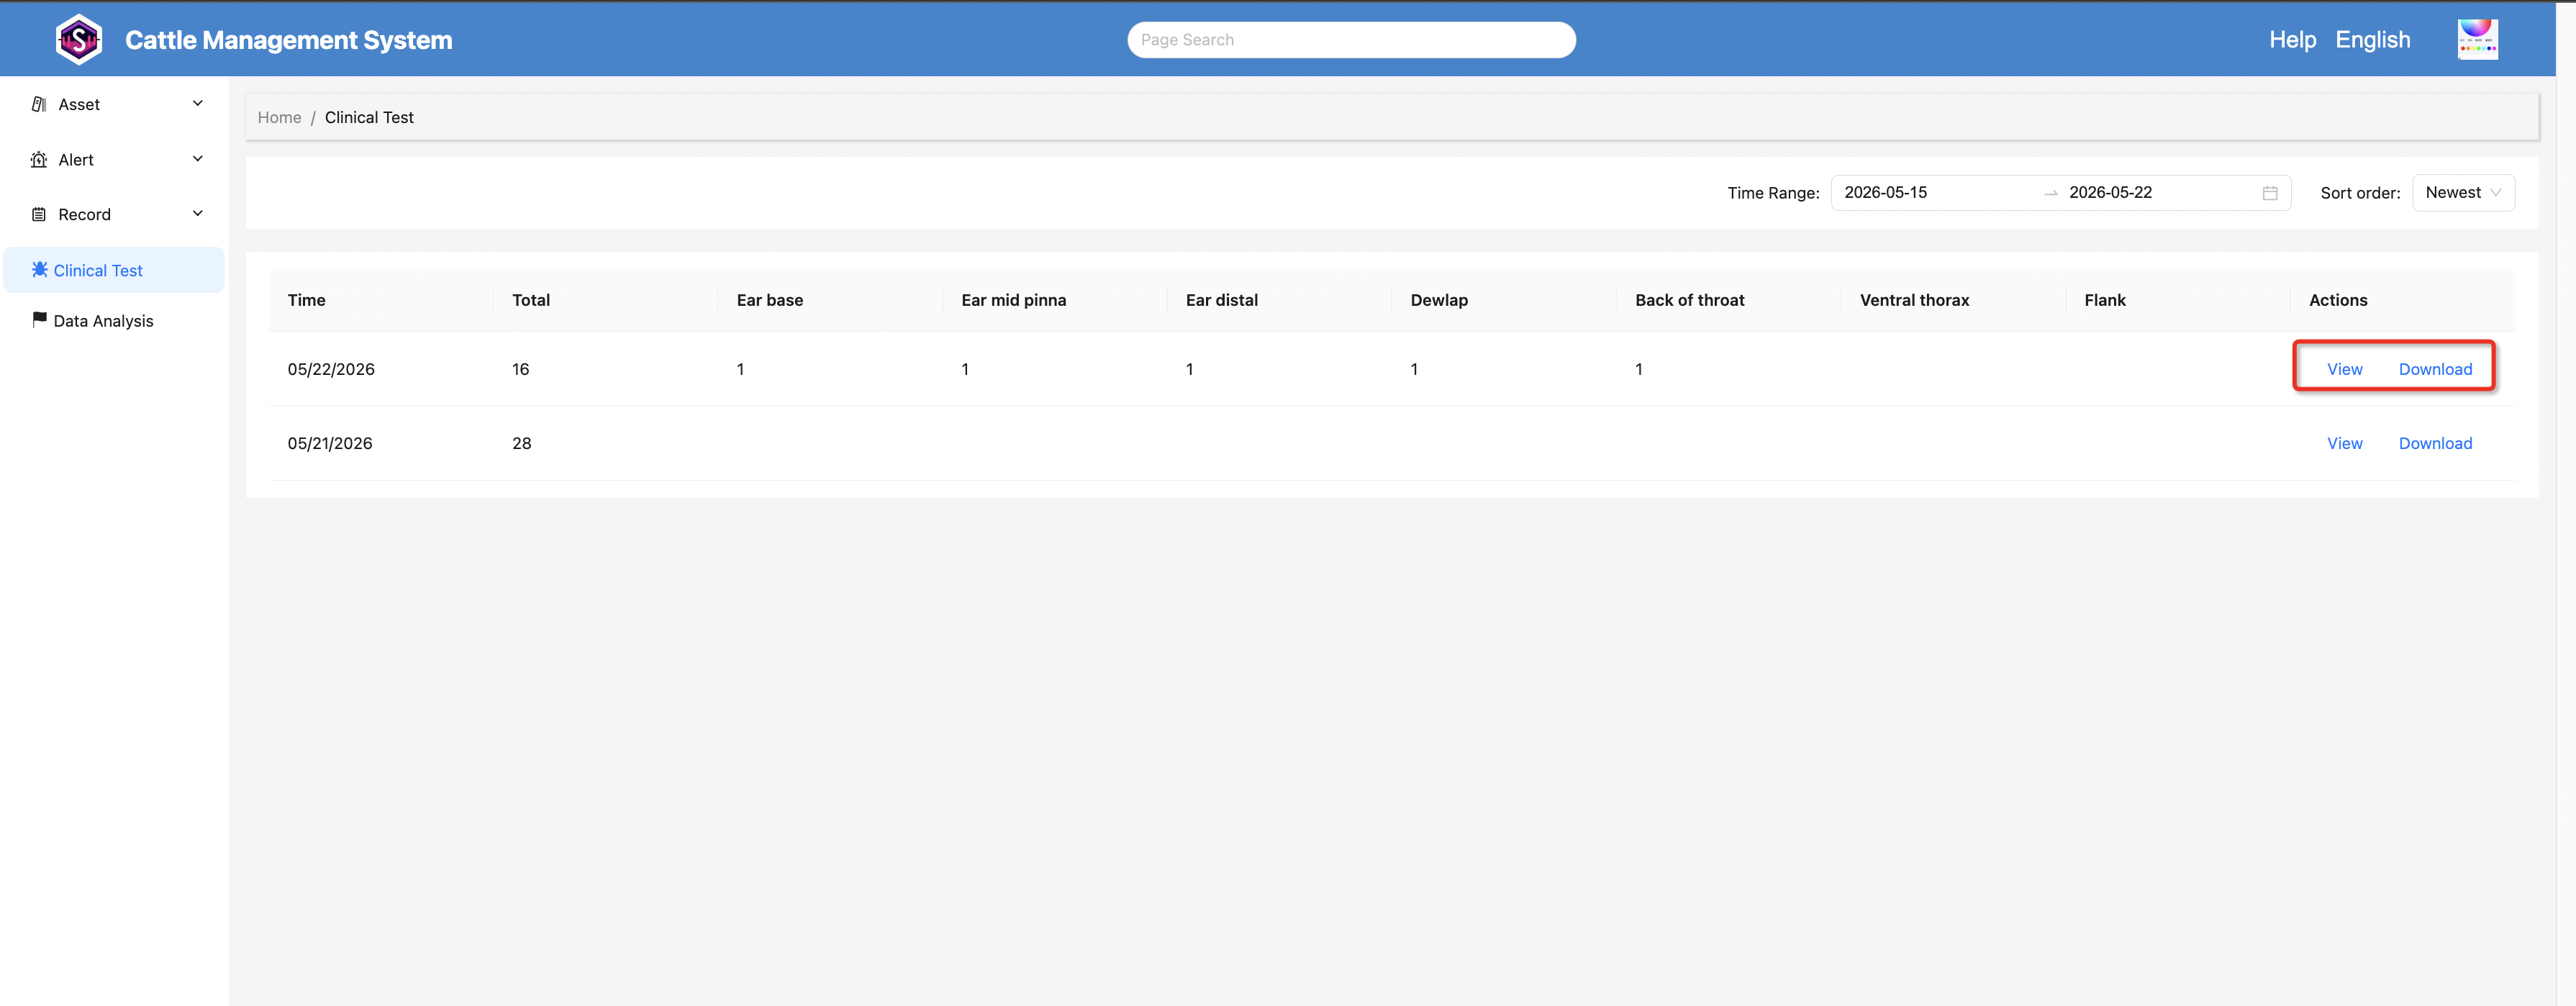
Page Actions
- Click Download to download all data for that day
- Click View to view detailed clinical test information for that day
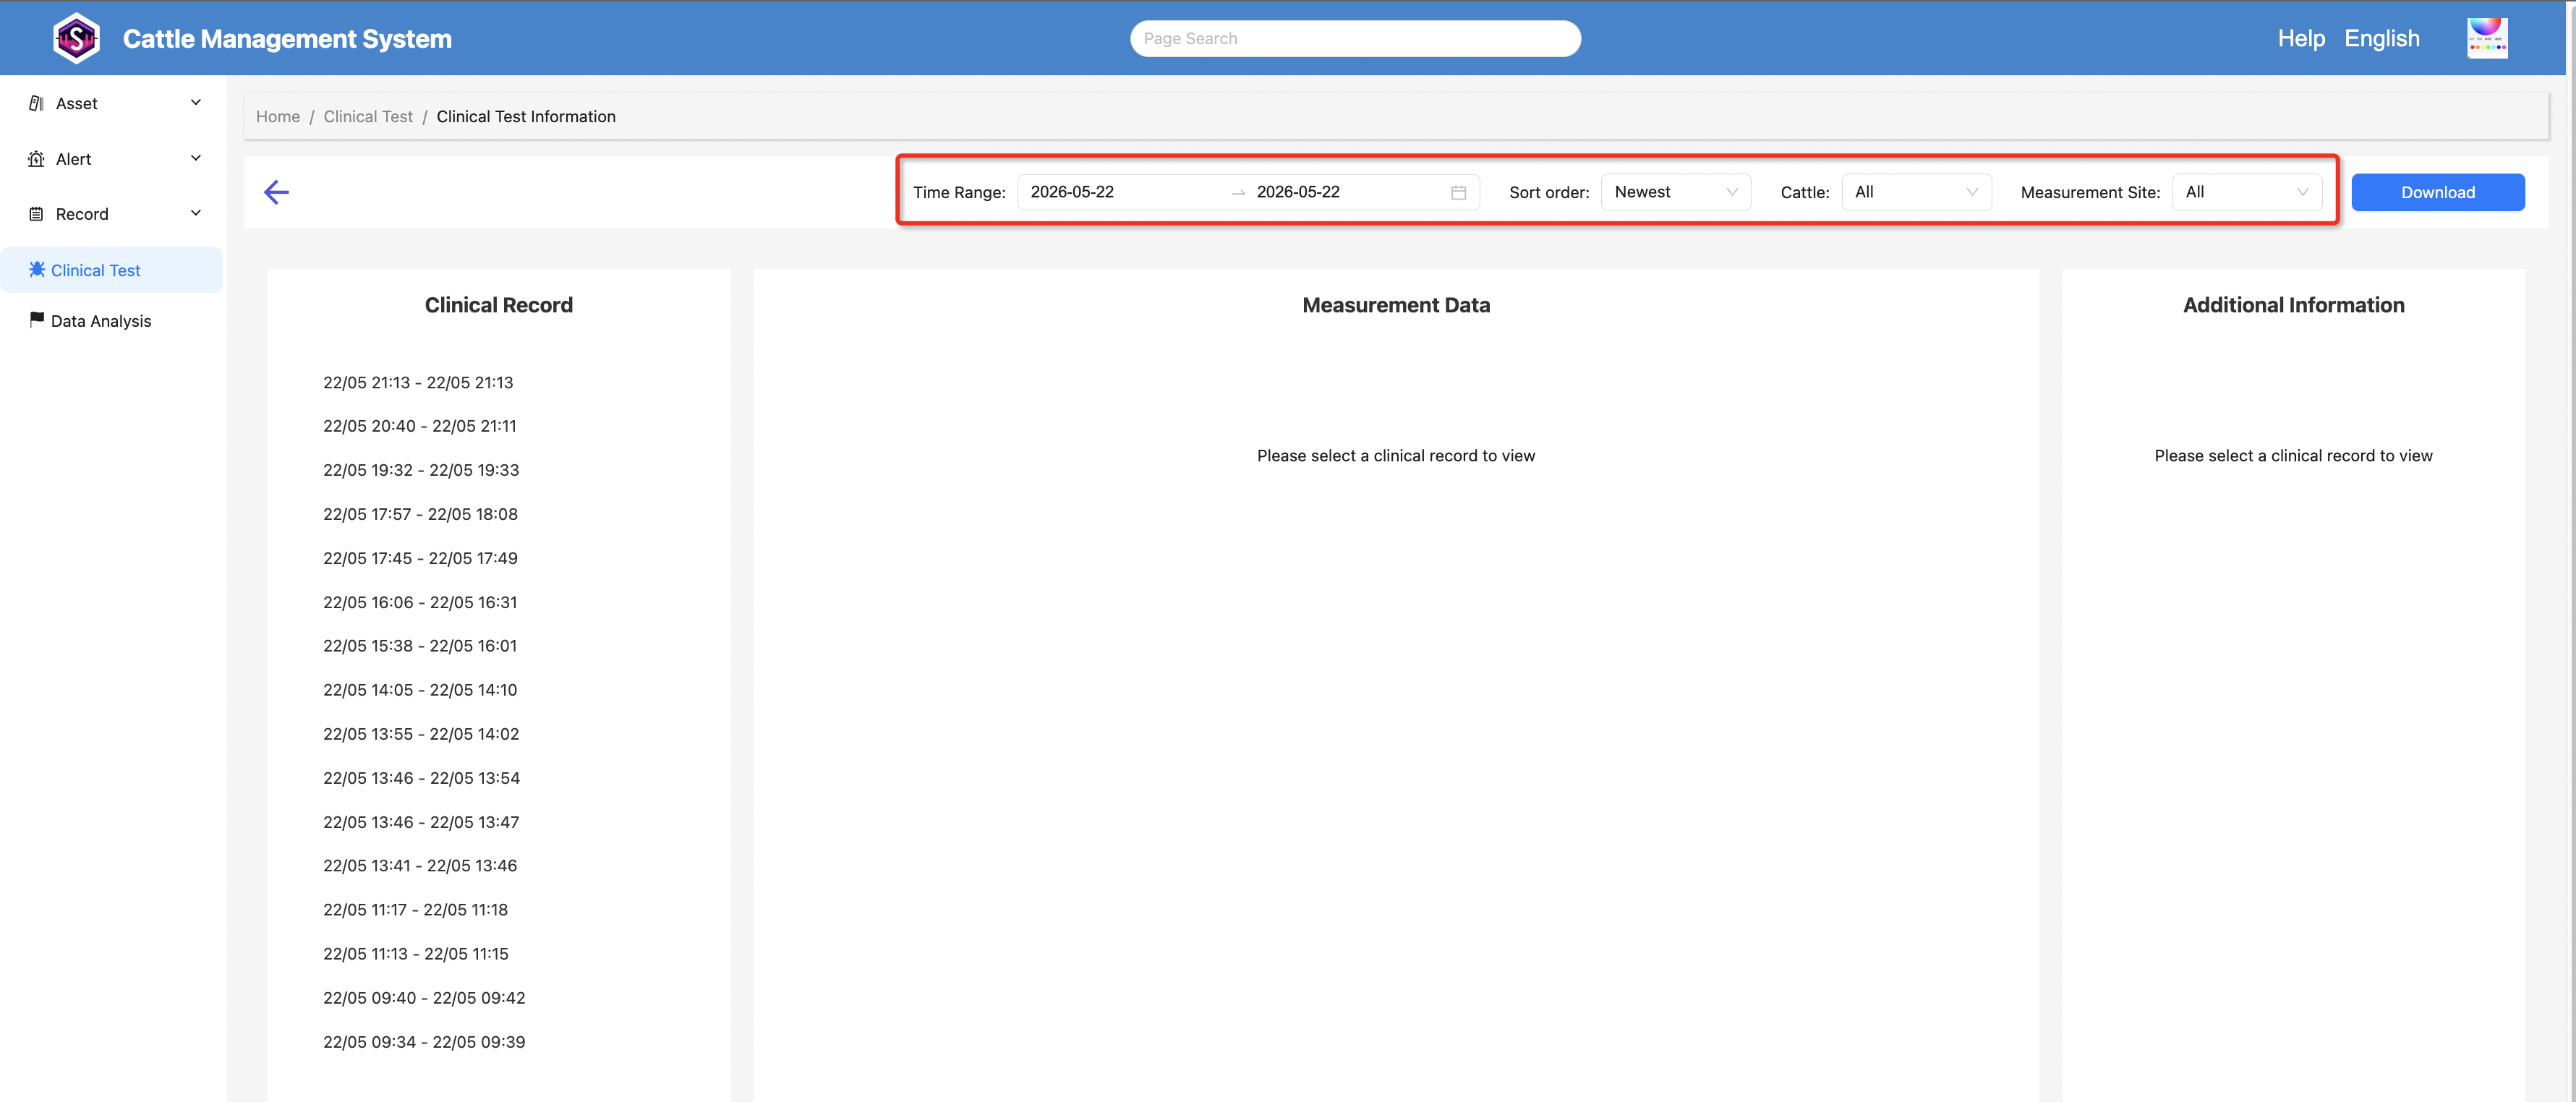
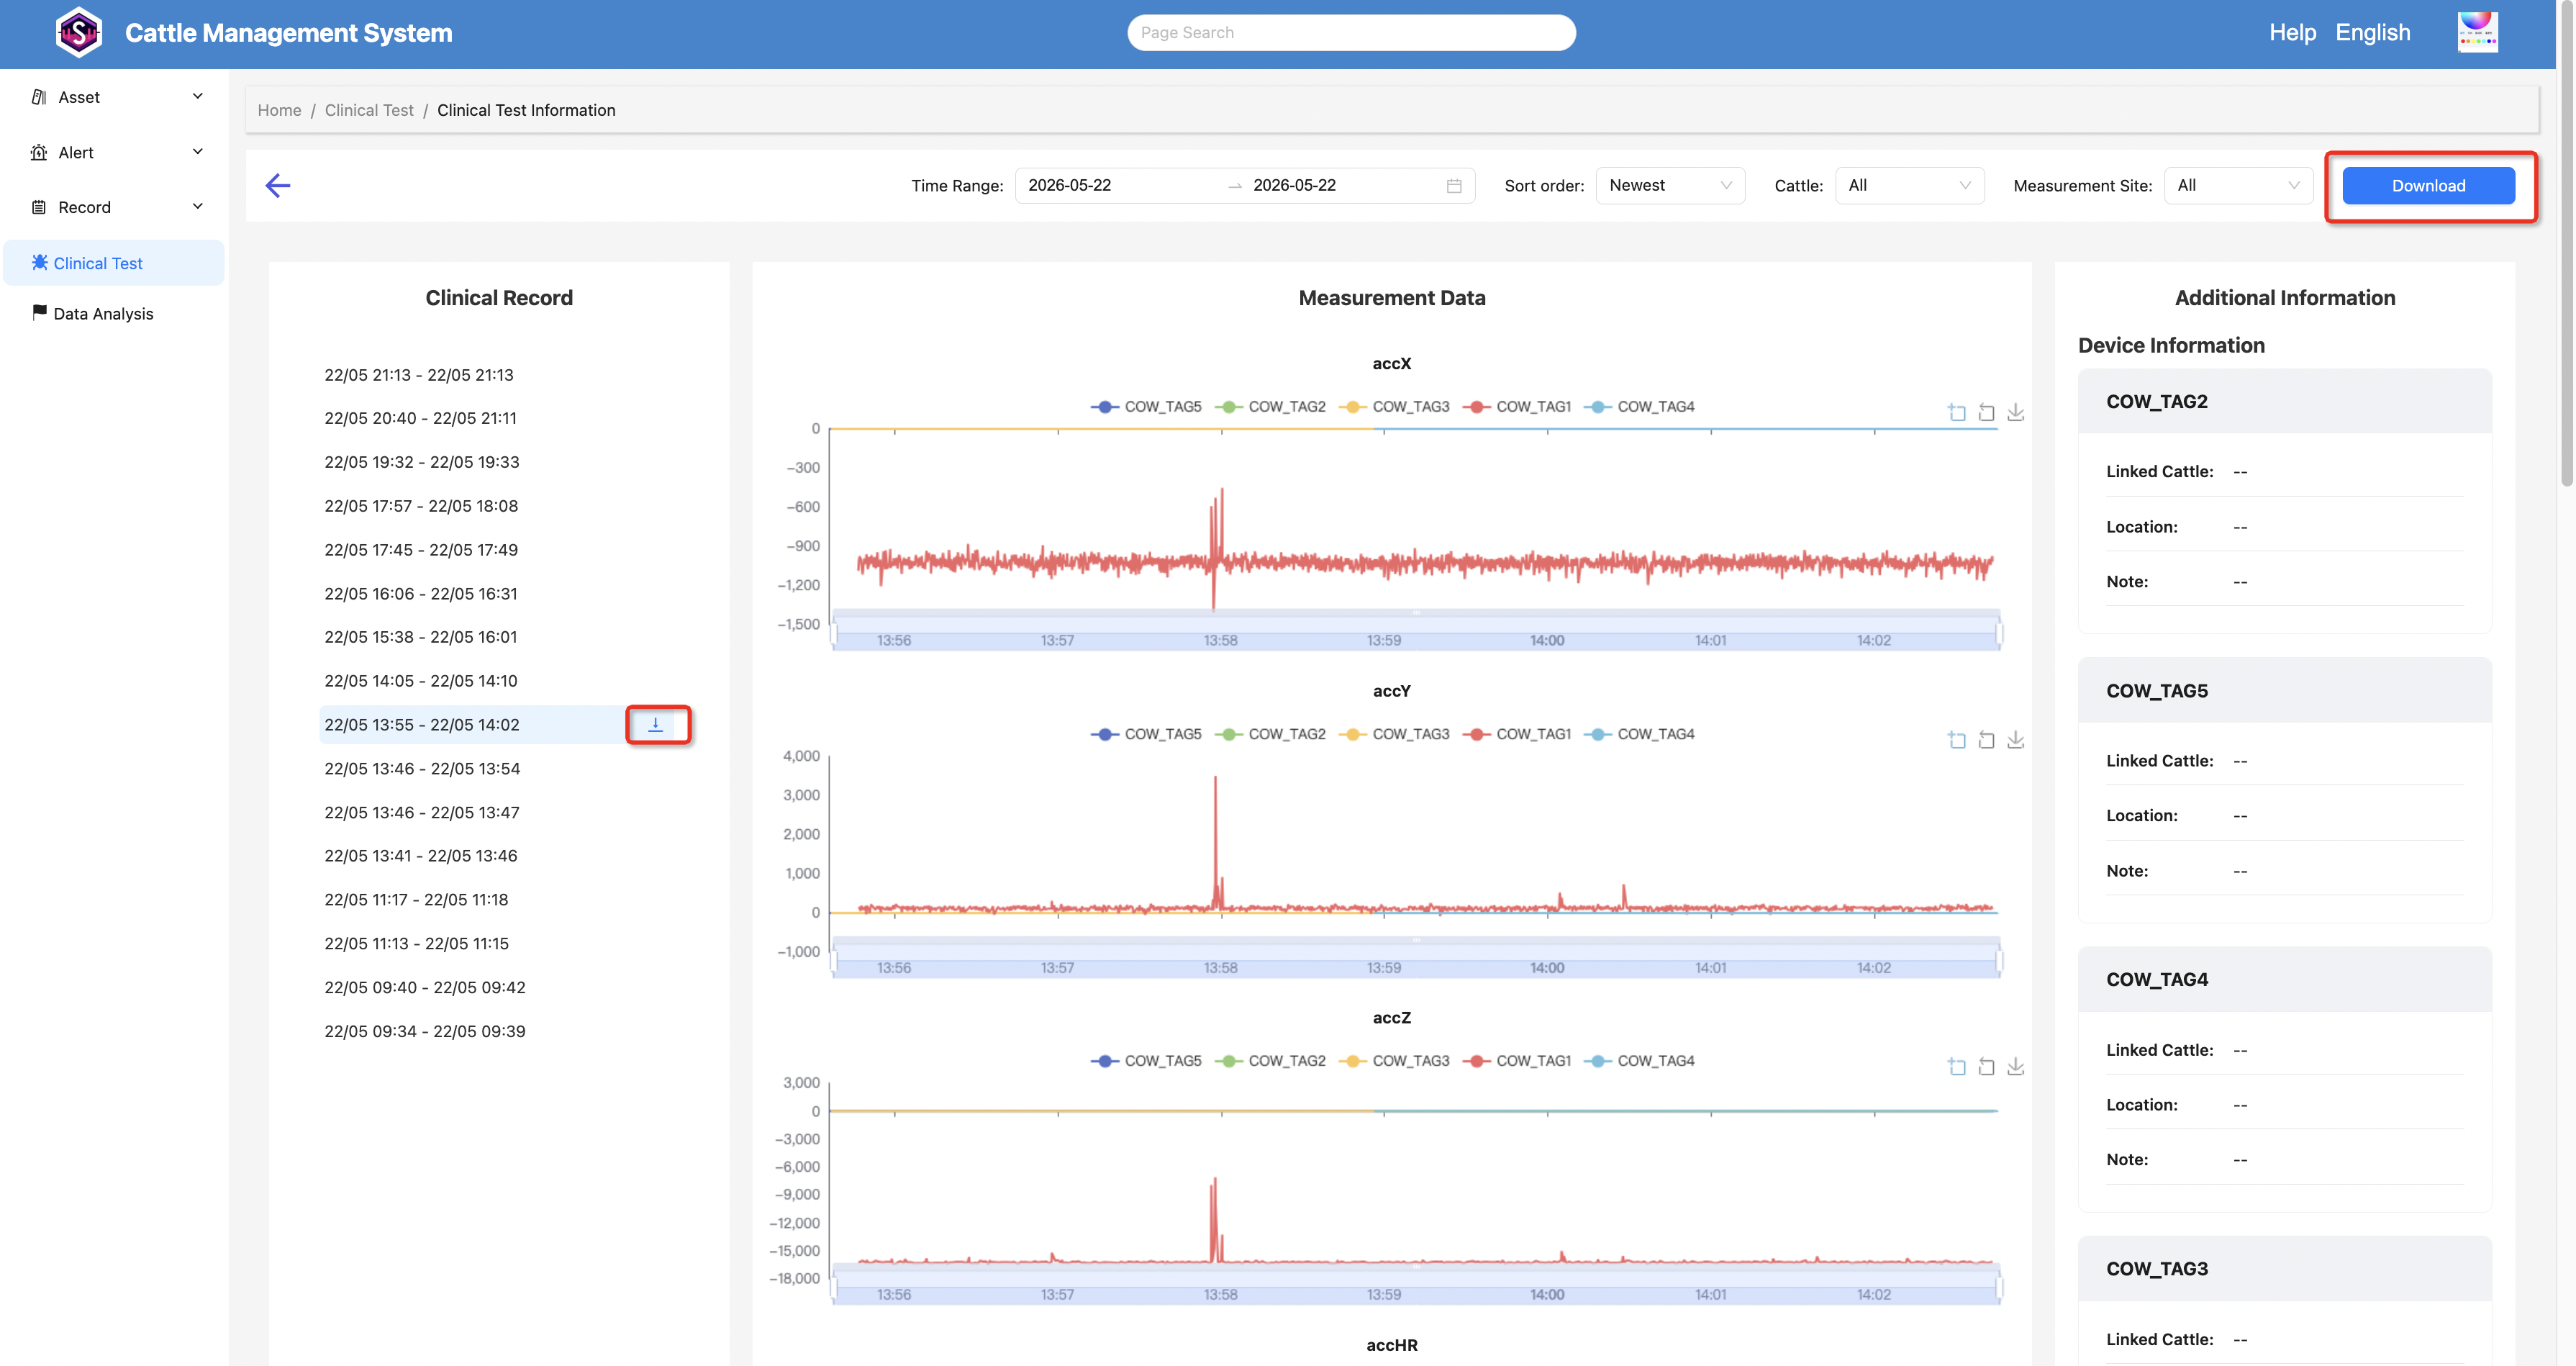
3. View Clinical Test Details
After entering the details page, you can view records from different time periods.
You can also filter data by:
- Time Range
- Measurement Location
- Cattle
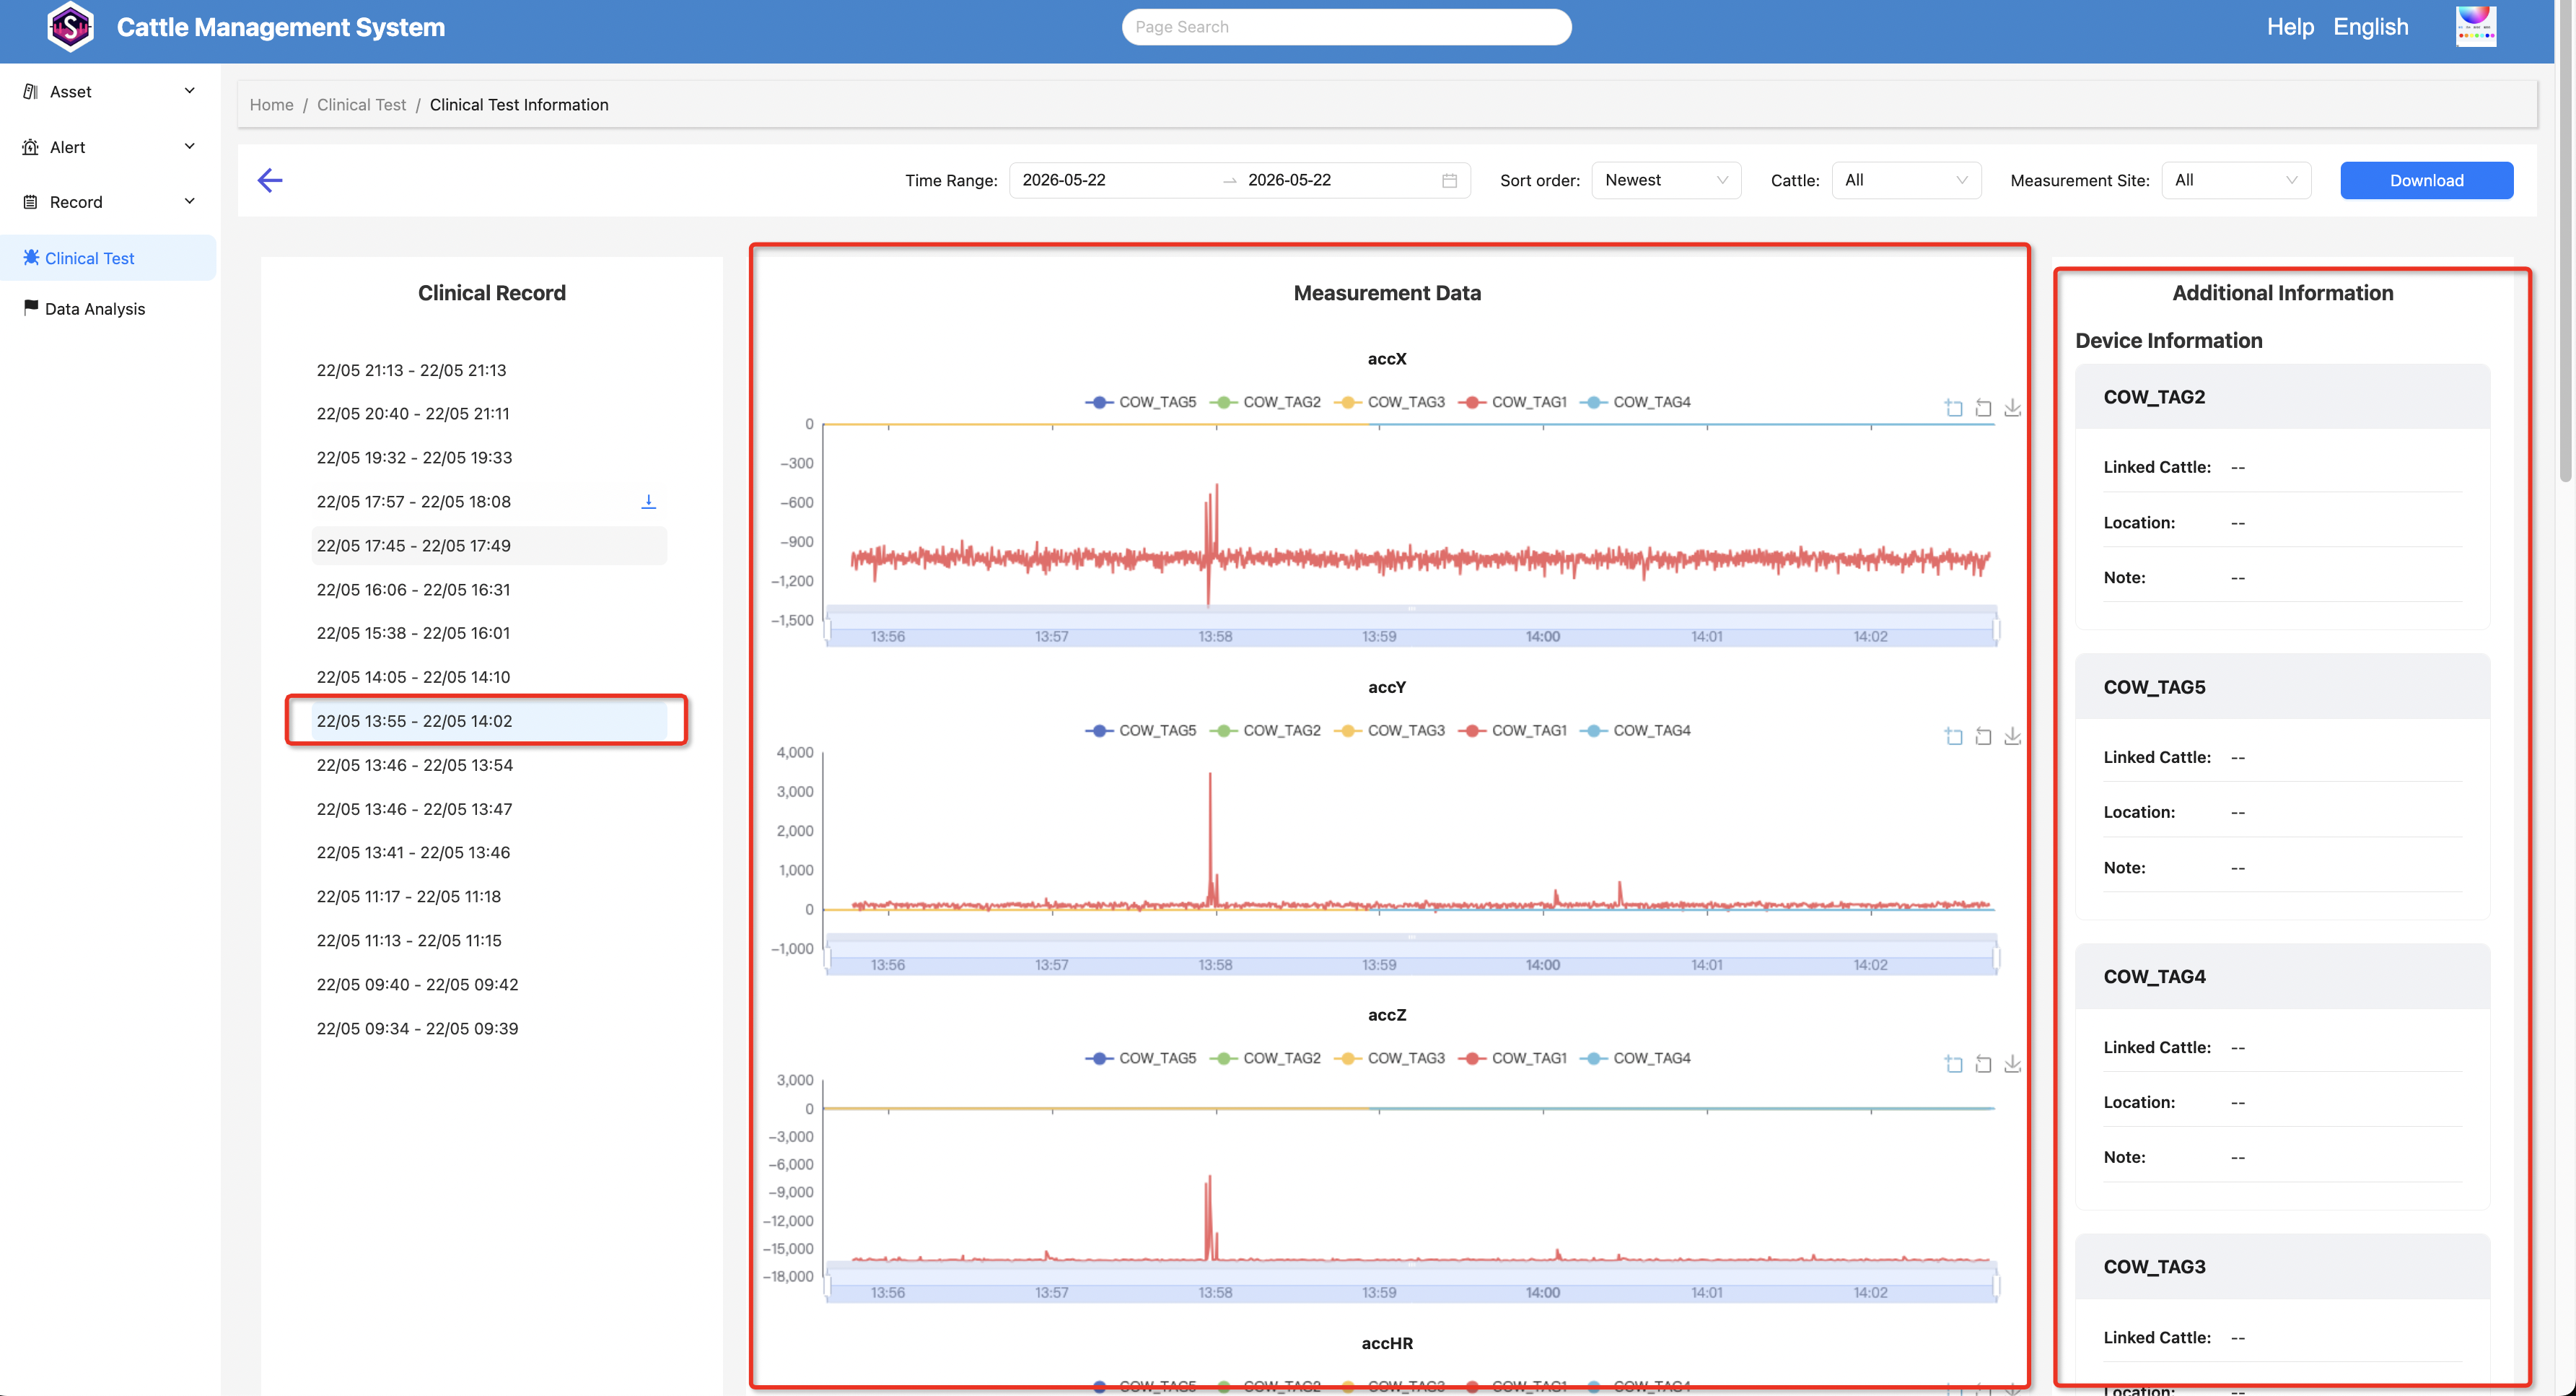
Data Viewing
- Click a clinical test record in the middle panel to view the measurement data for that time period.
- The right panel will display detailed information about the selected record, including:
- Devices used
- Bound cattle
- Measurement locations
- Notes
4. Data Download
- Hover your mouse over a record to display the download icon.
- Click the download icon to download the raw data for that specific record.
- Click the download button in the upper-right corner to download all raw data within a selected time range.
For faster downloads, it is recommended to keep the selected time range as small as possible.
Import ECG Data and Download Data
Import ECG Data
1. Open Data Analysis Page
In the backend system:
- Click Data Analysis
- Open the ECG Data page from the top menu
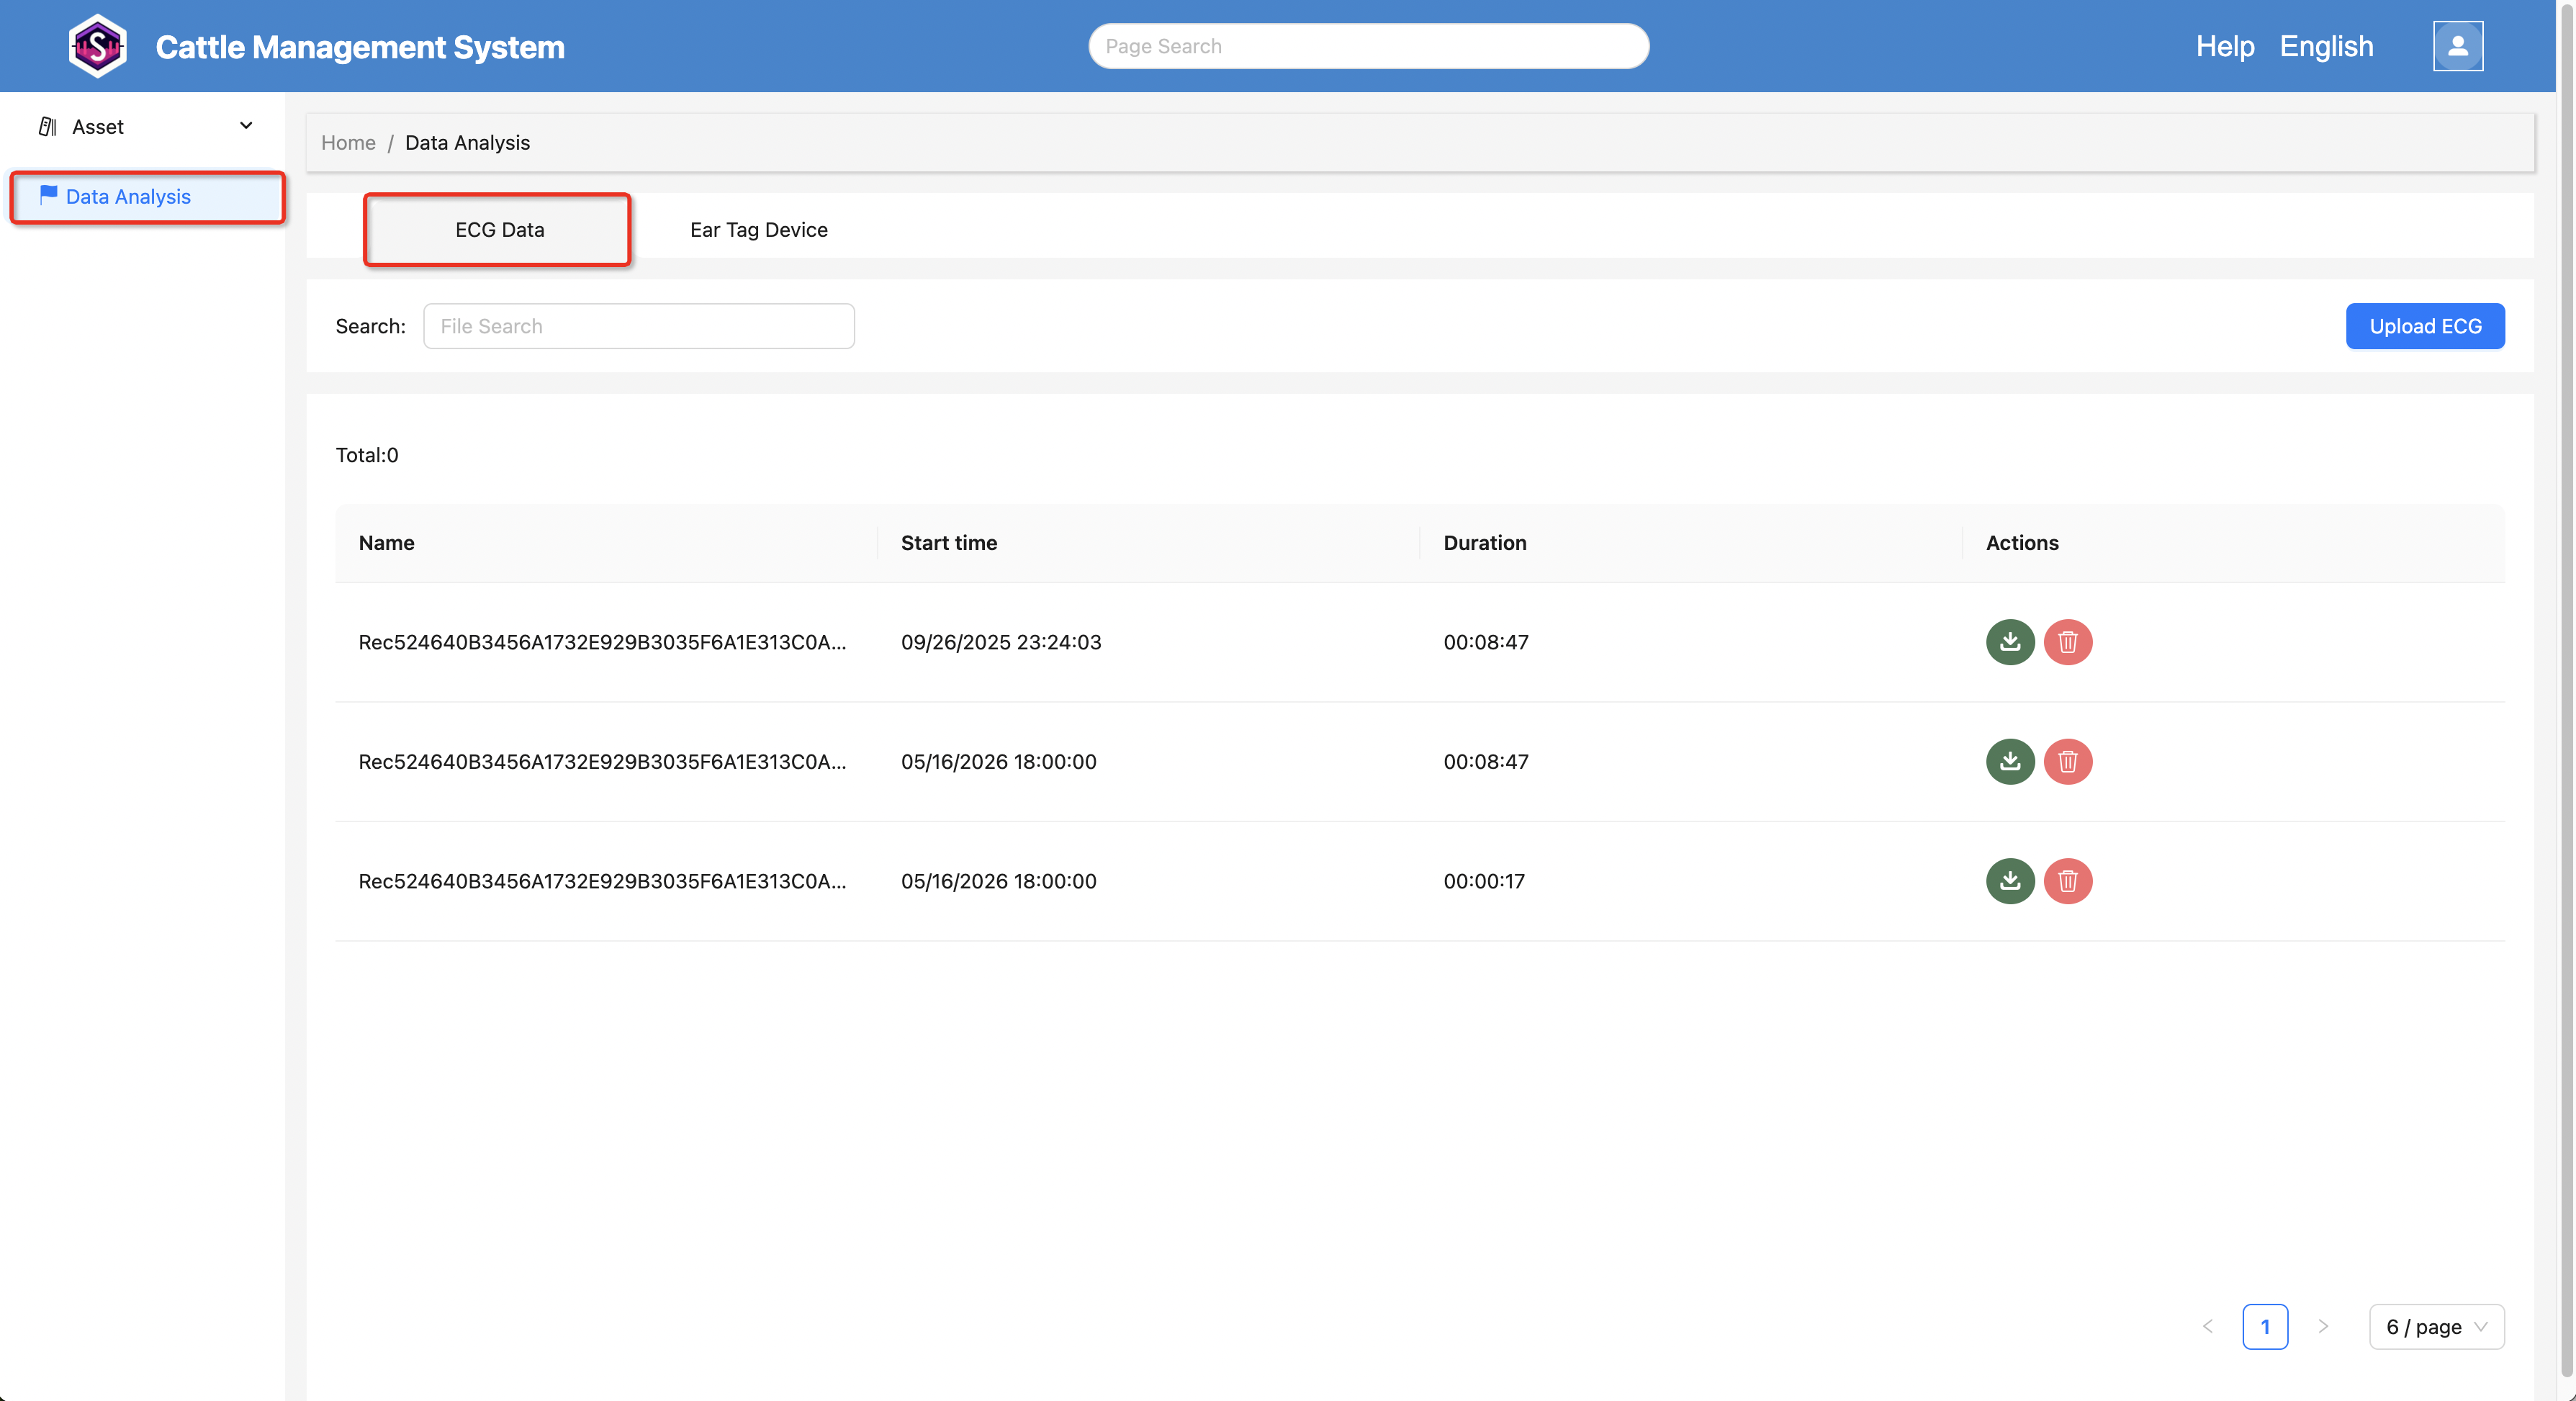
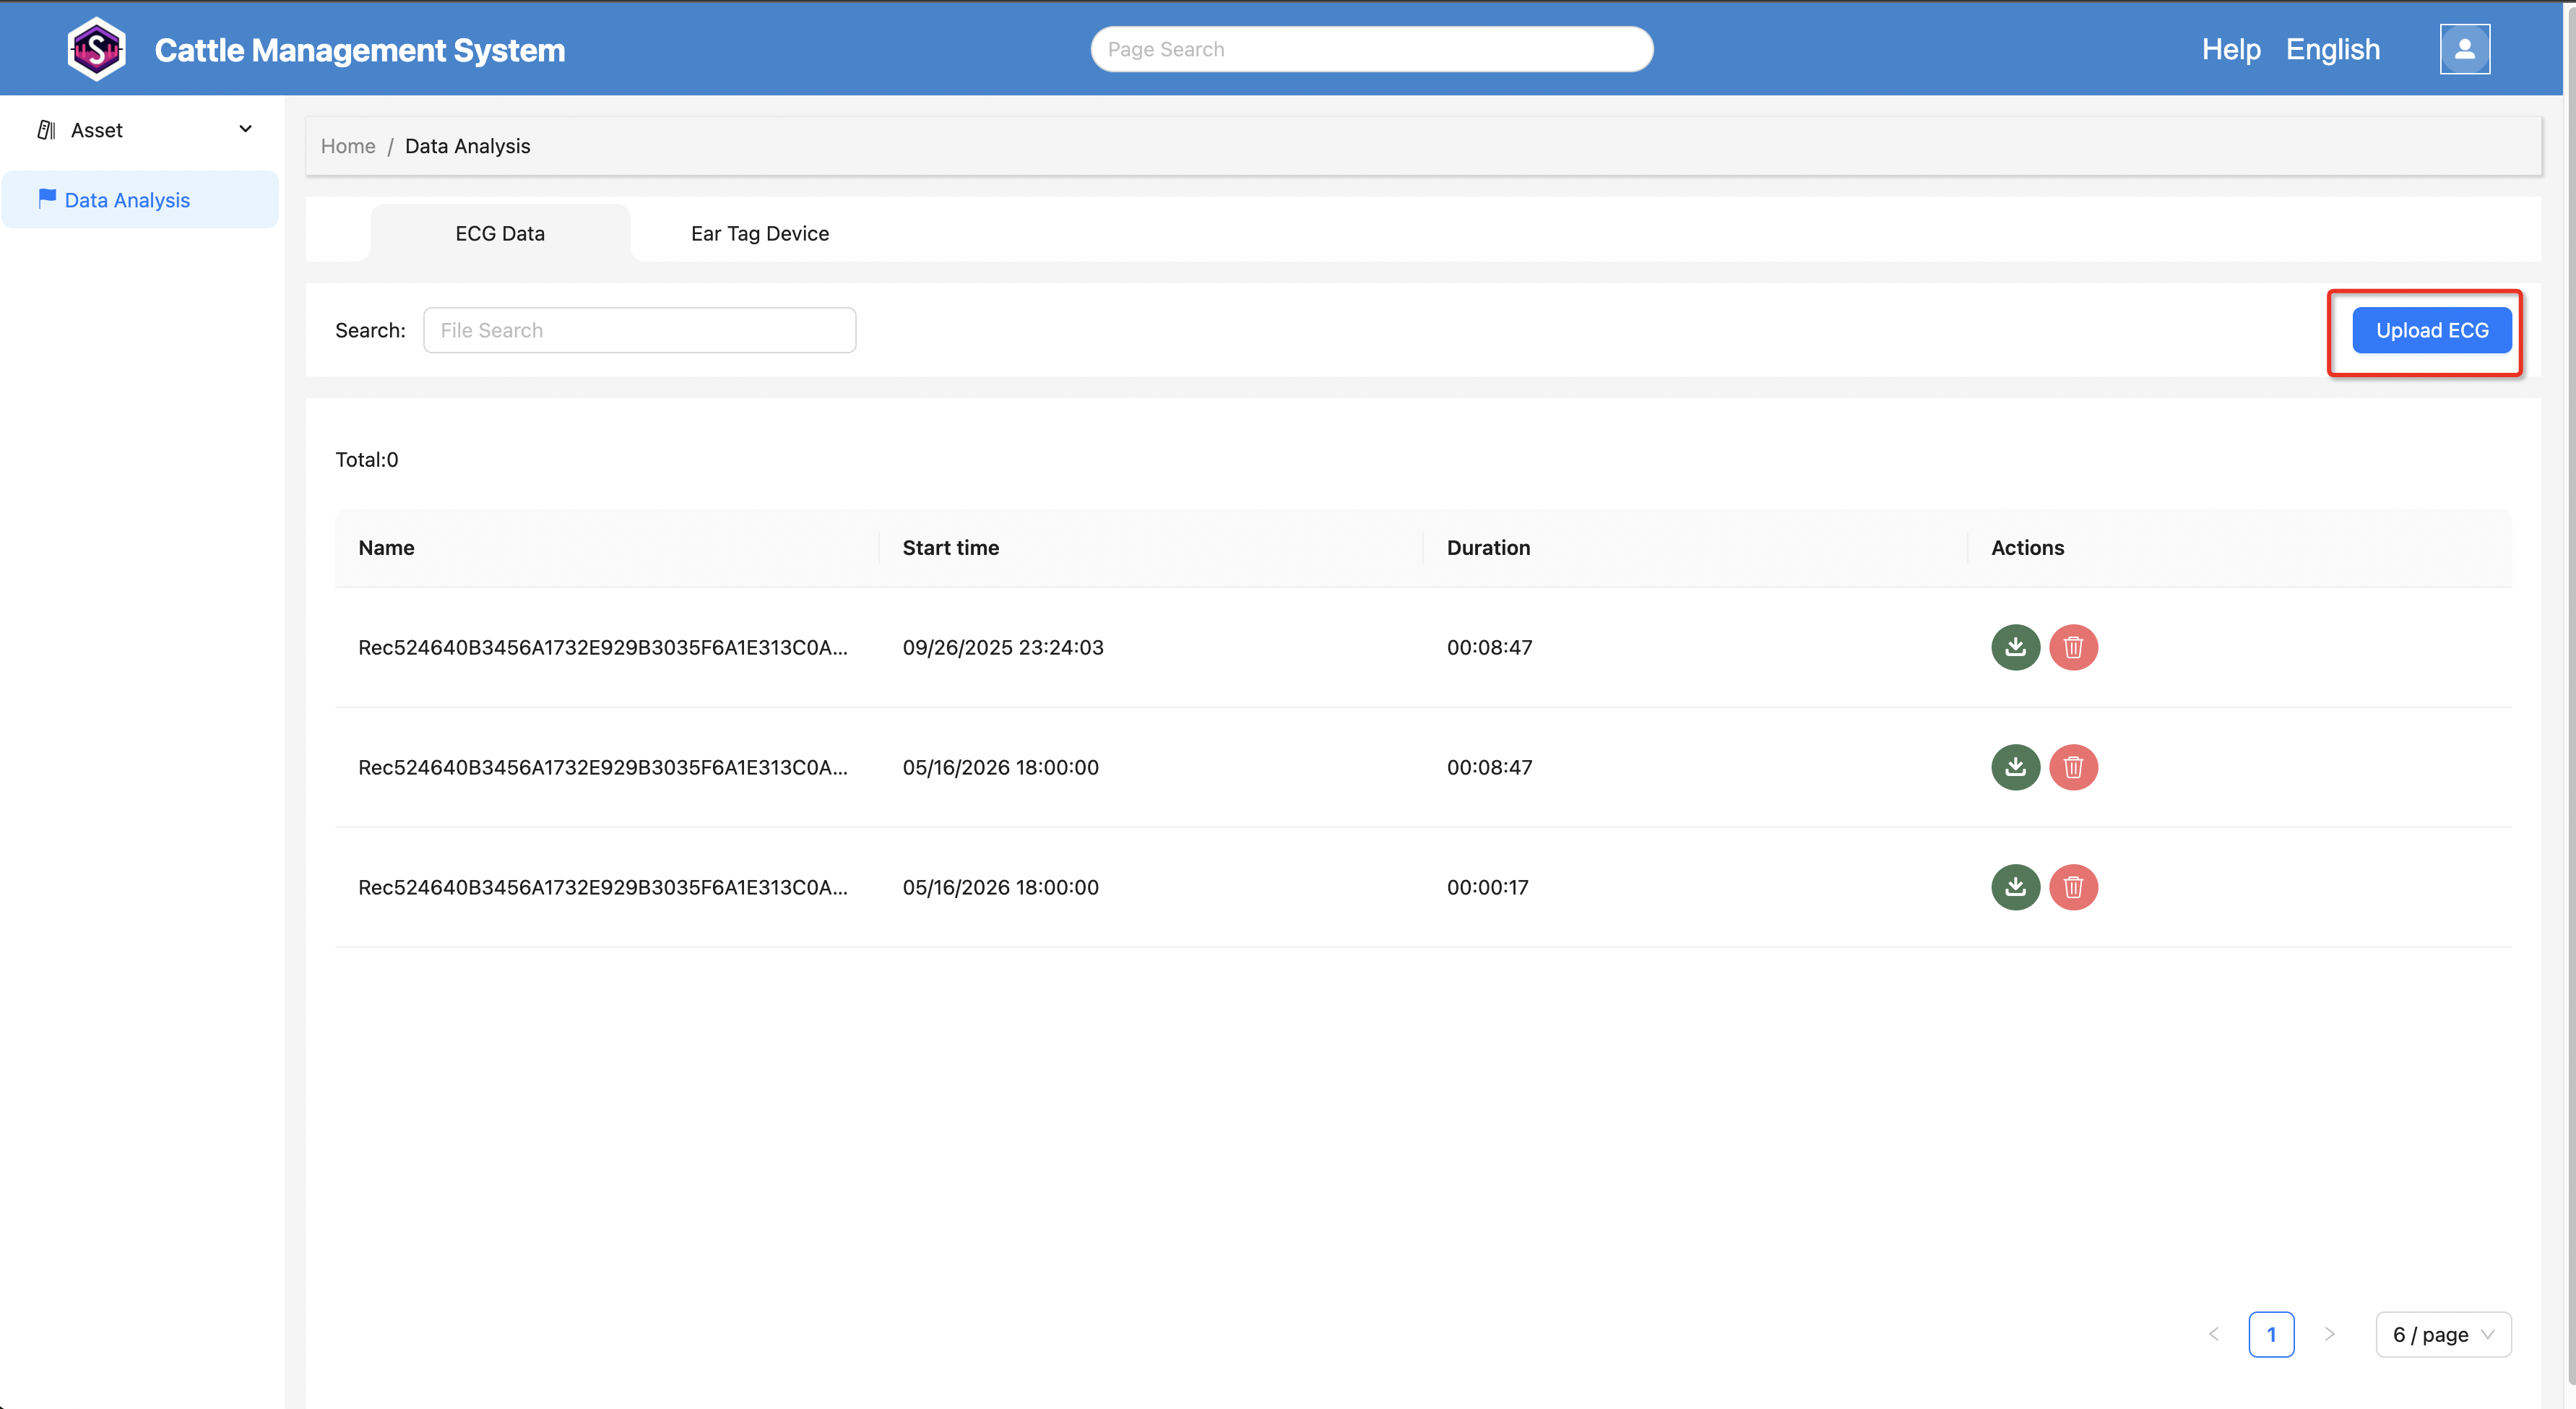
2. Upload ECG File
Click the Upload ECG button and select the ECG file to import.
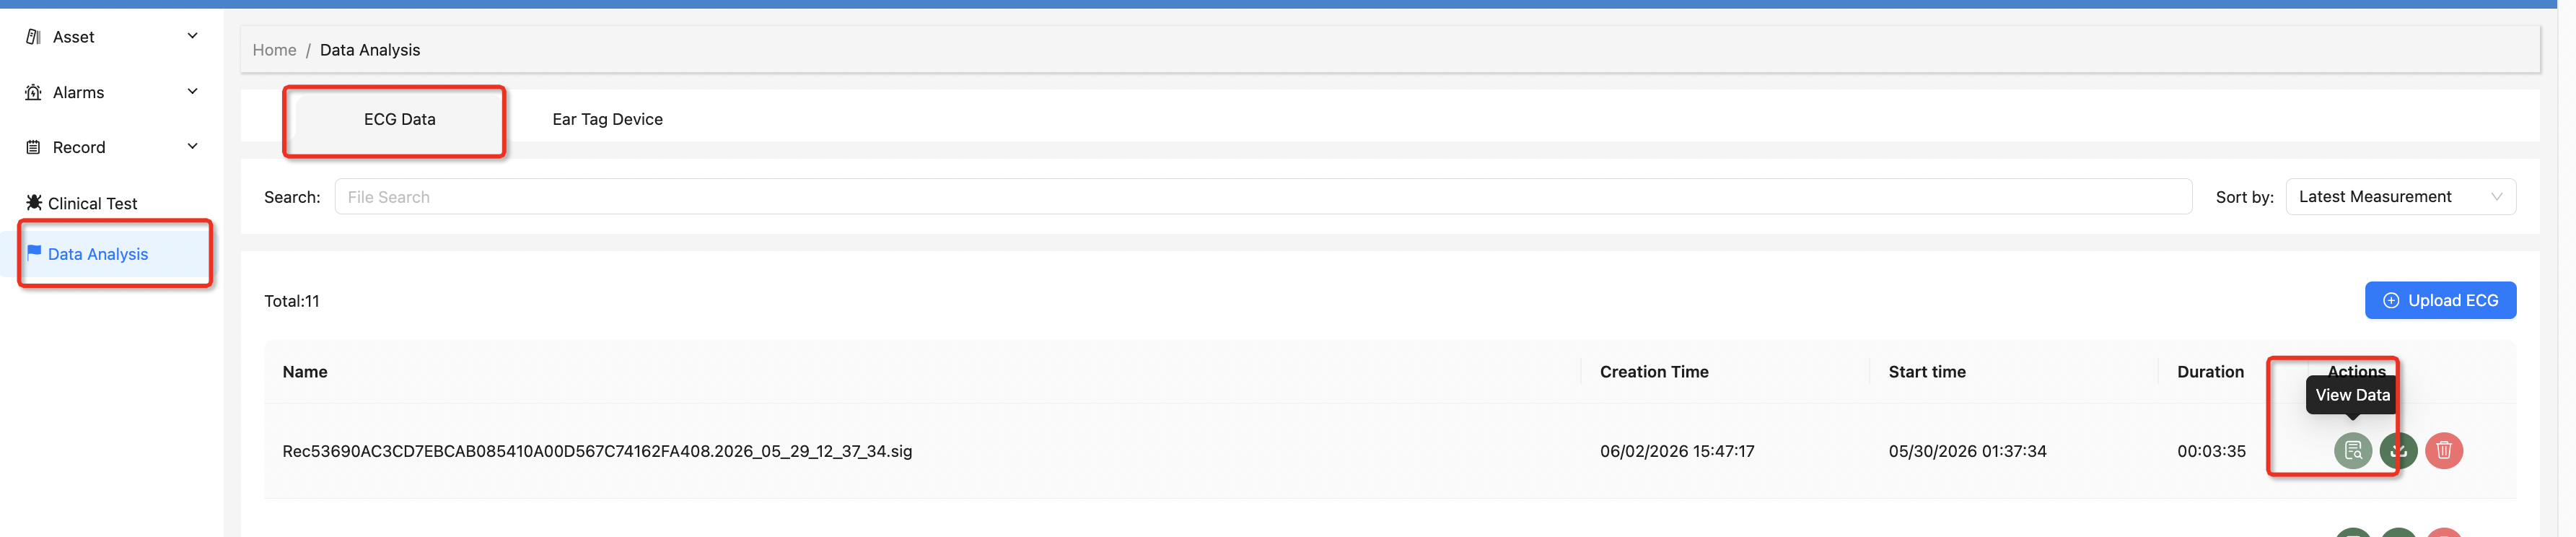
View ECG and Ear Tag Raw Data
1. Enter the ECG Data Page
In the ECG list, click the view icon to enter the ECG data page.
2. Page Overview
This page is divided into two main sections:
- Left panel: Device selection, signal configuration, and chart settings
- Right panel: ECG and multi-device raw data line charts
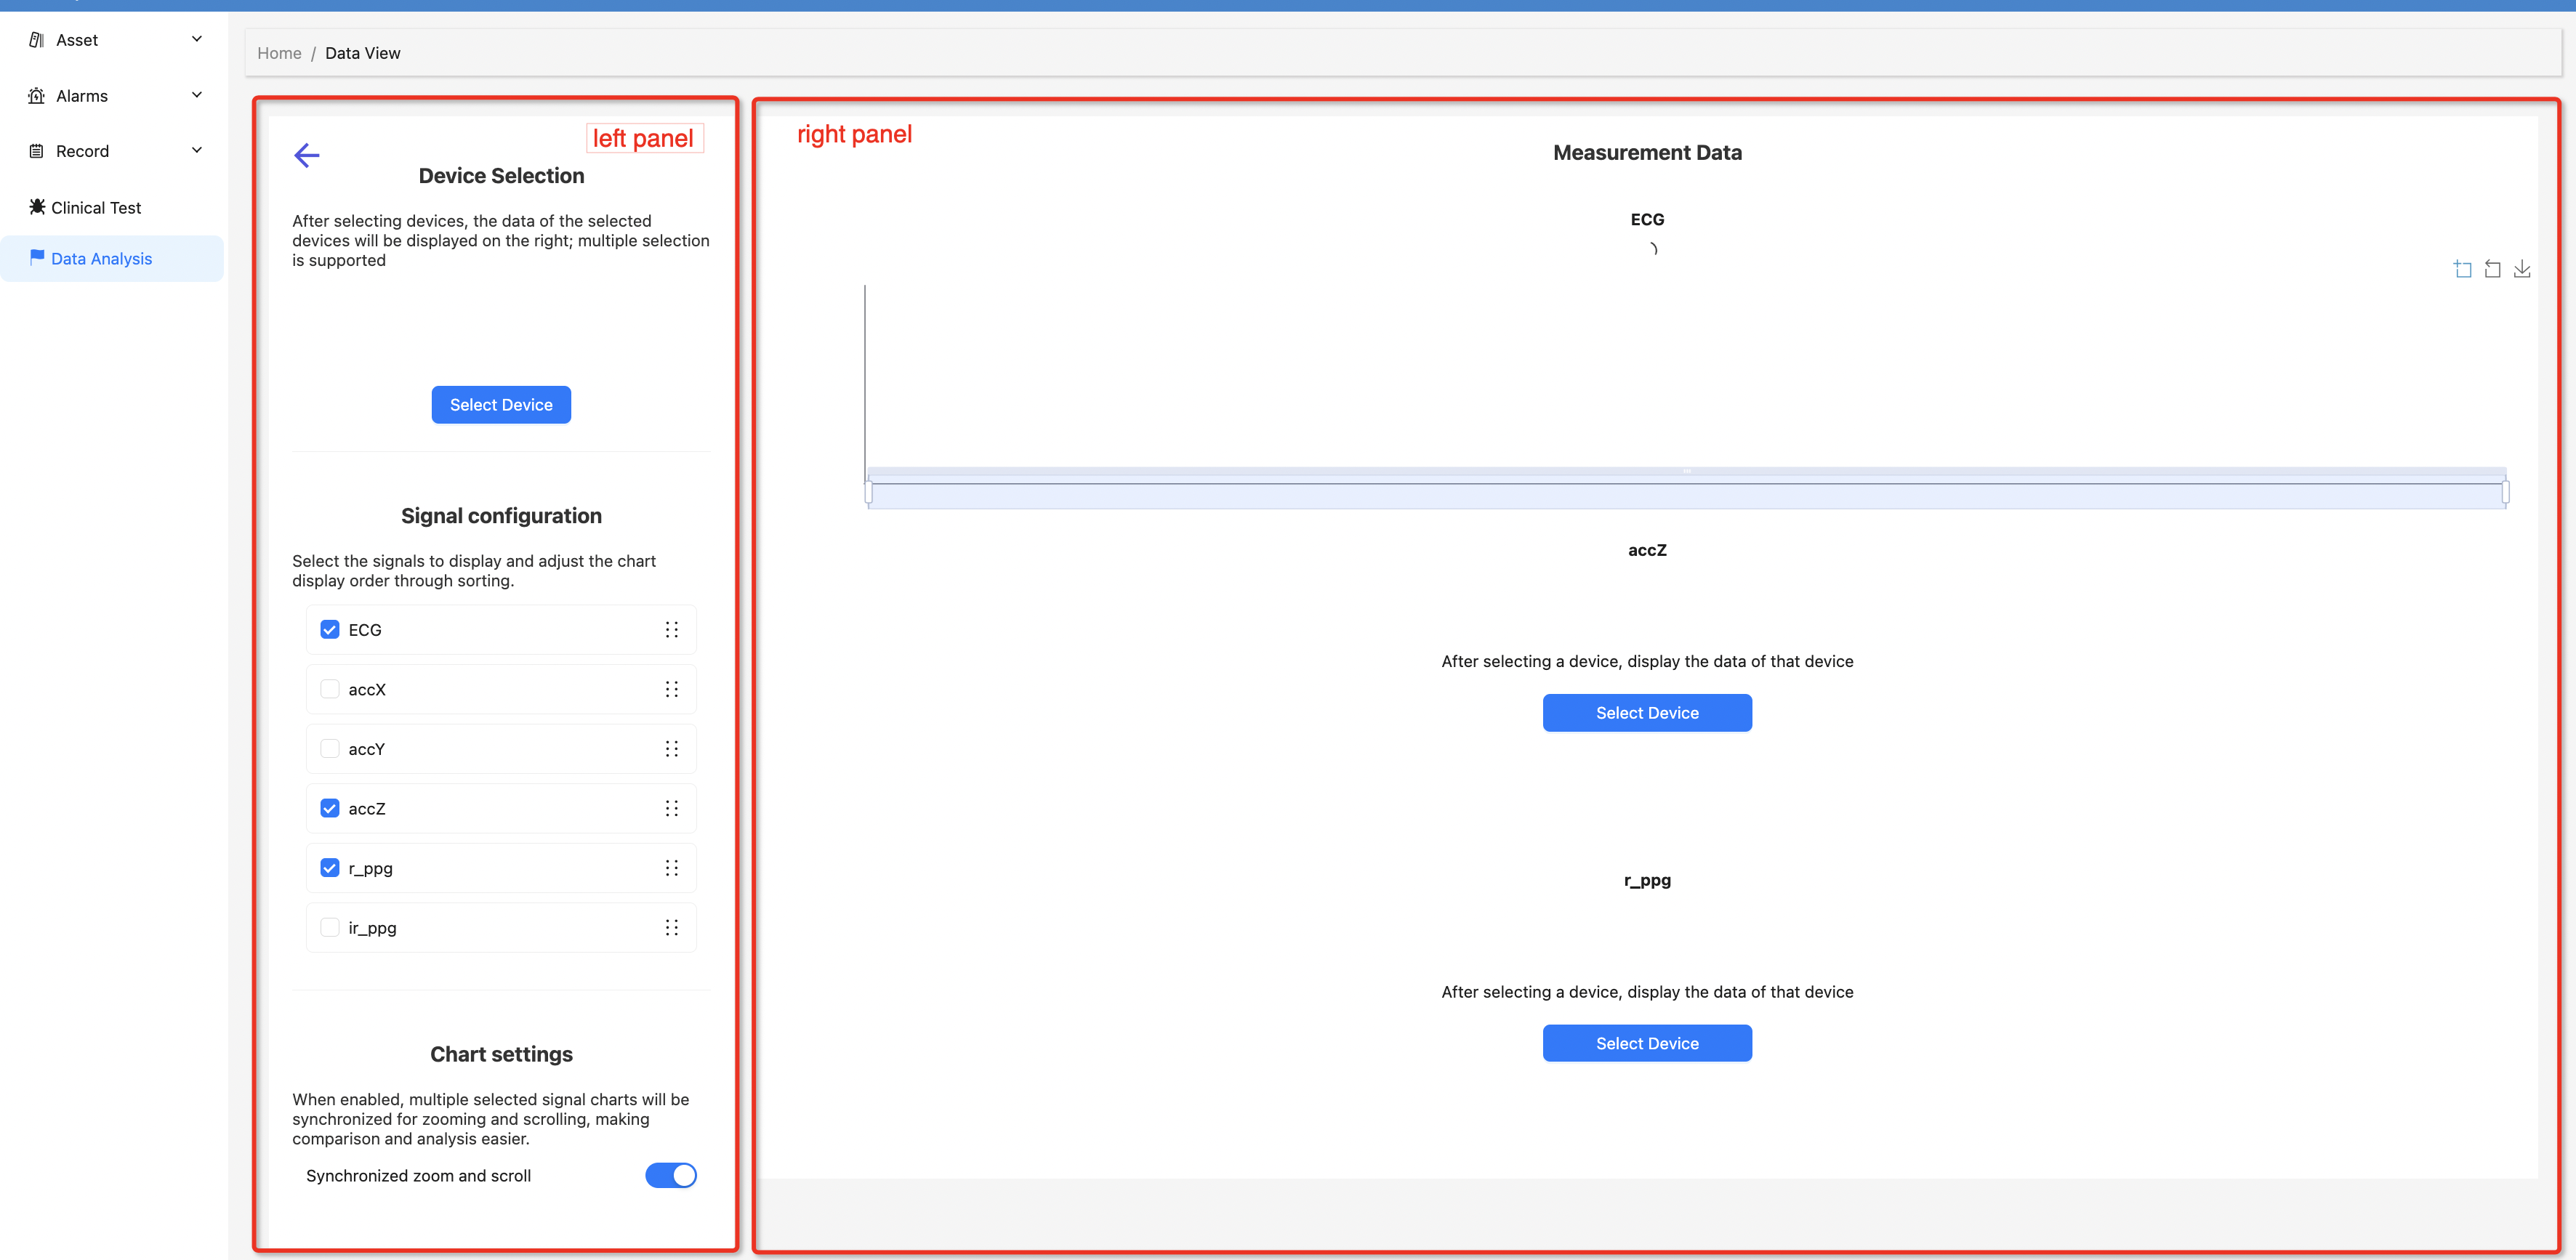
Left Panel
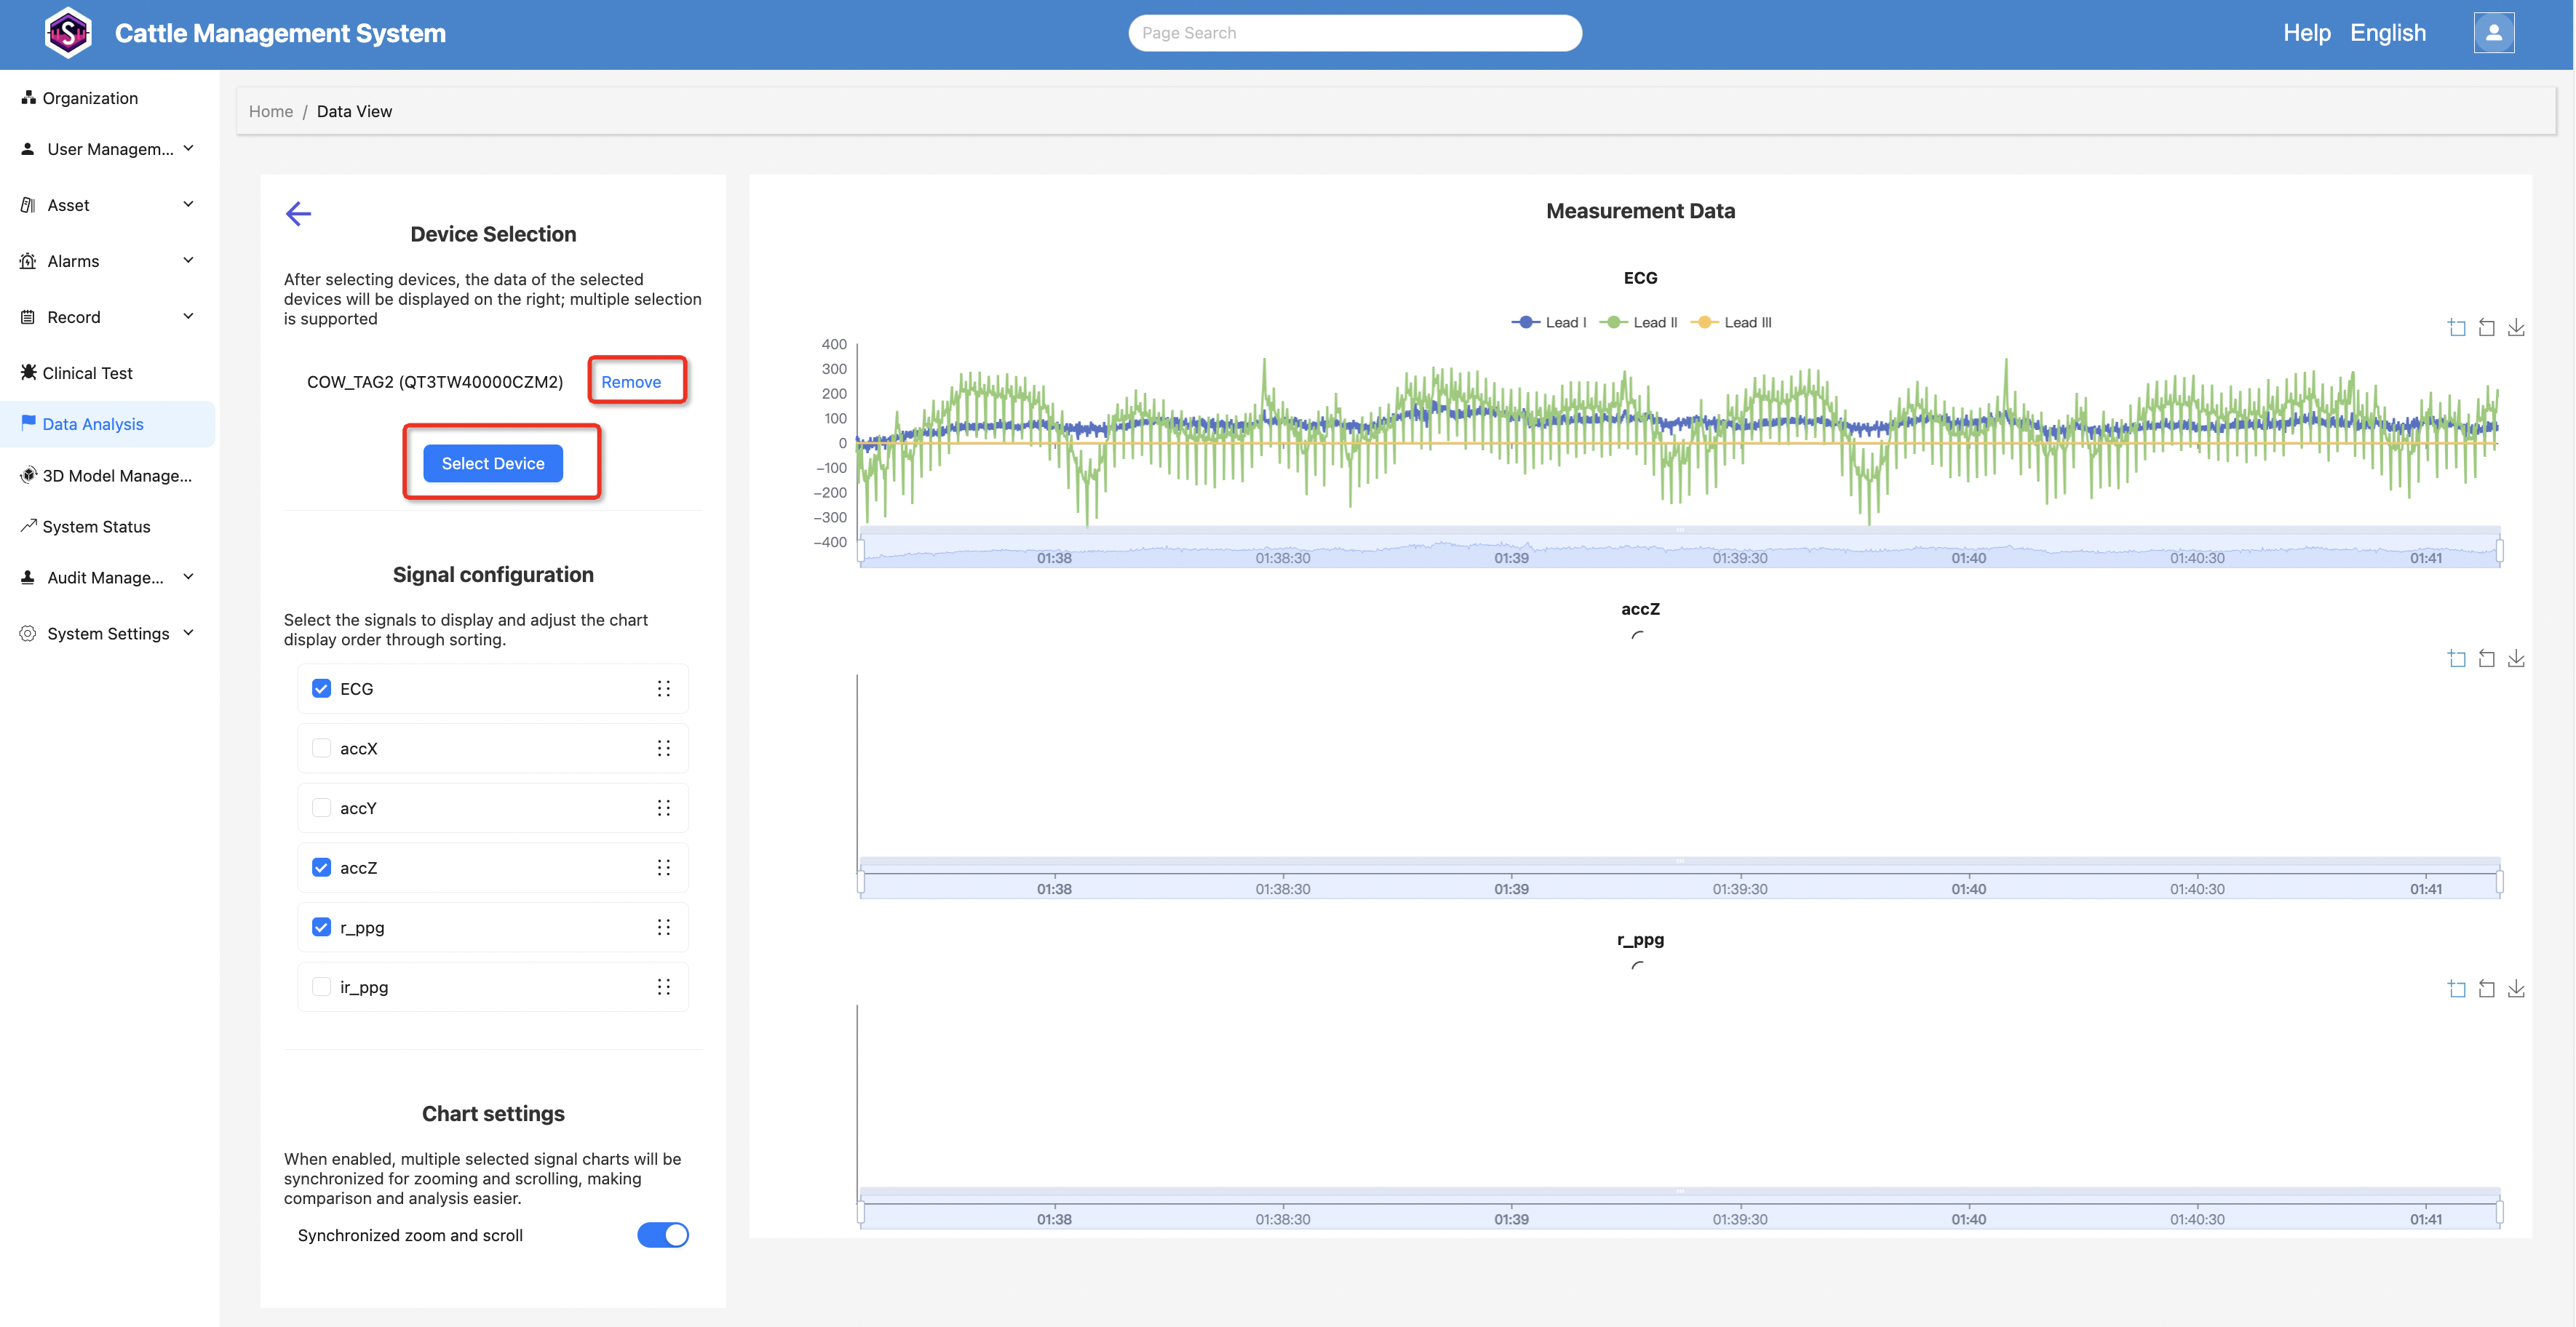
Device Selection
After ECG data is loaded, you can select devices here. Multiple selection is supported.
The right panel will then load the raw data corresponding to the selected devices.
- Remove device: Only removes the device data from the right-side charts. It does not delete the device or its raw data.
Signal Configuration
This section provides multiple signal options, including: ECG, accX, accY, accZ, r_ppg, and ir_ppg.
- When a signal is selected, the right panel will display the corresponding raw data line chart for the selected devices
- Signal ordering is supported, and the order will directly affect the display sequence of charts on the right
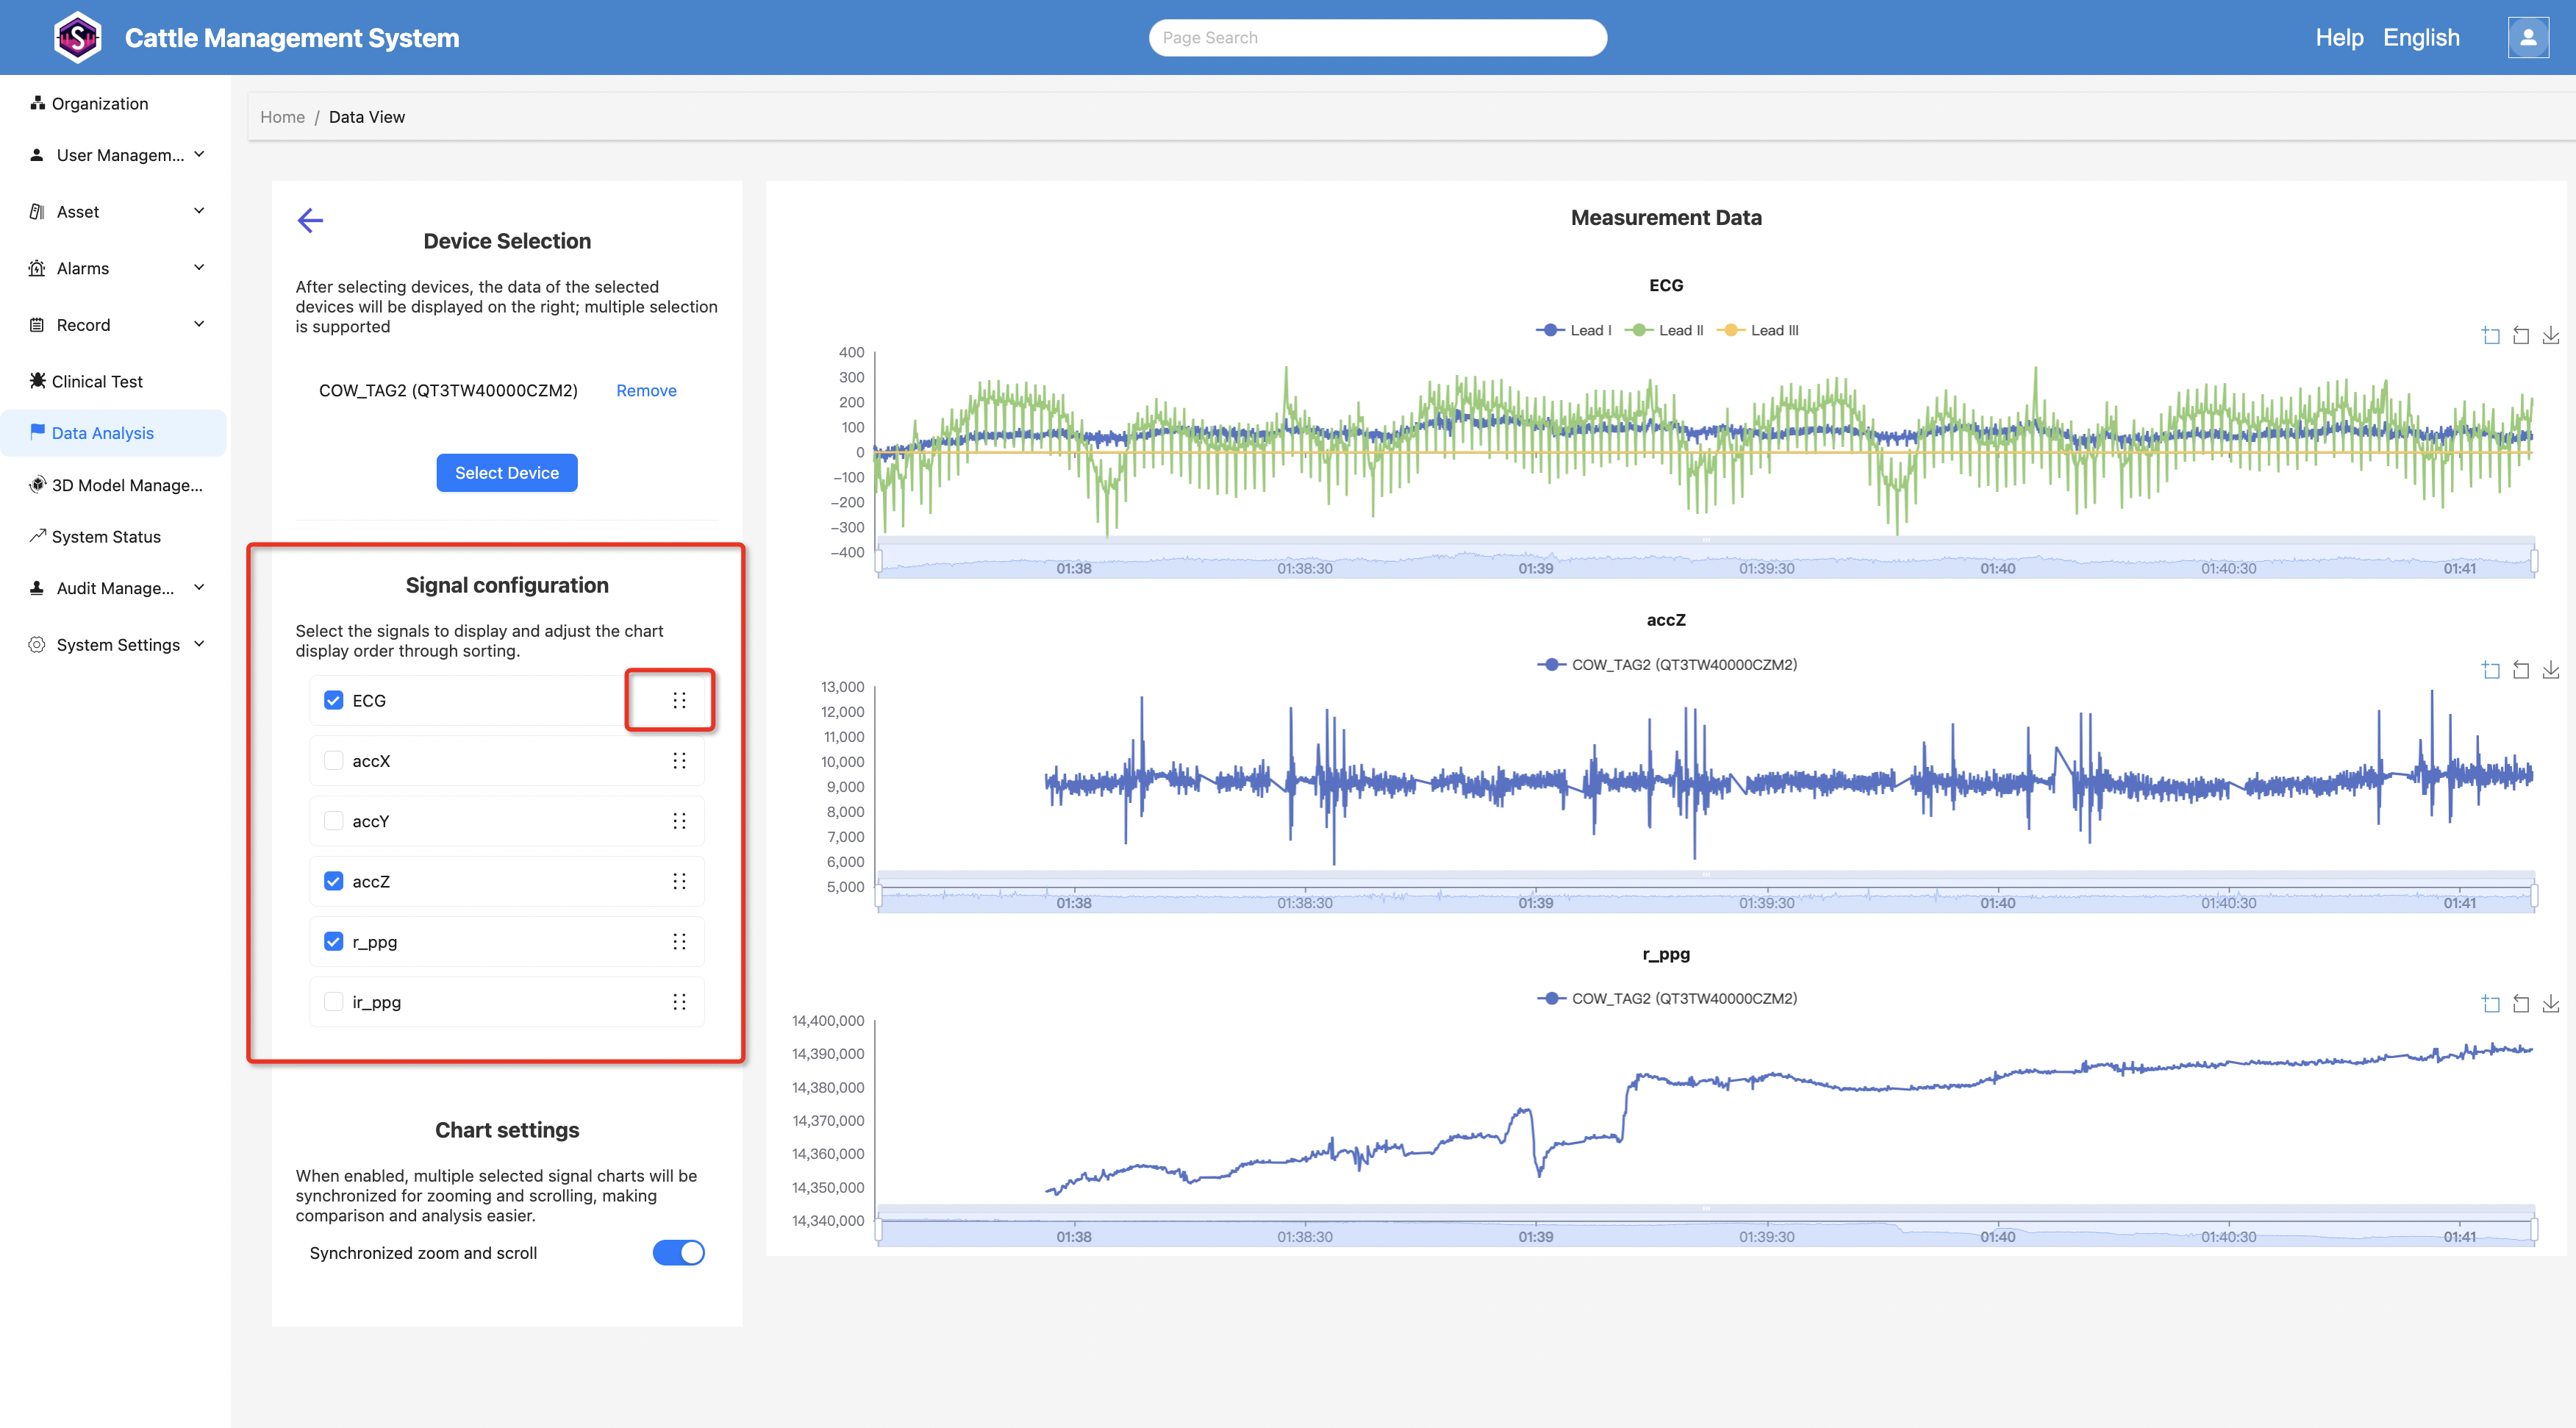
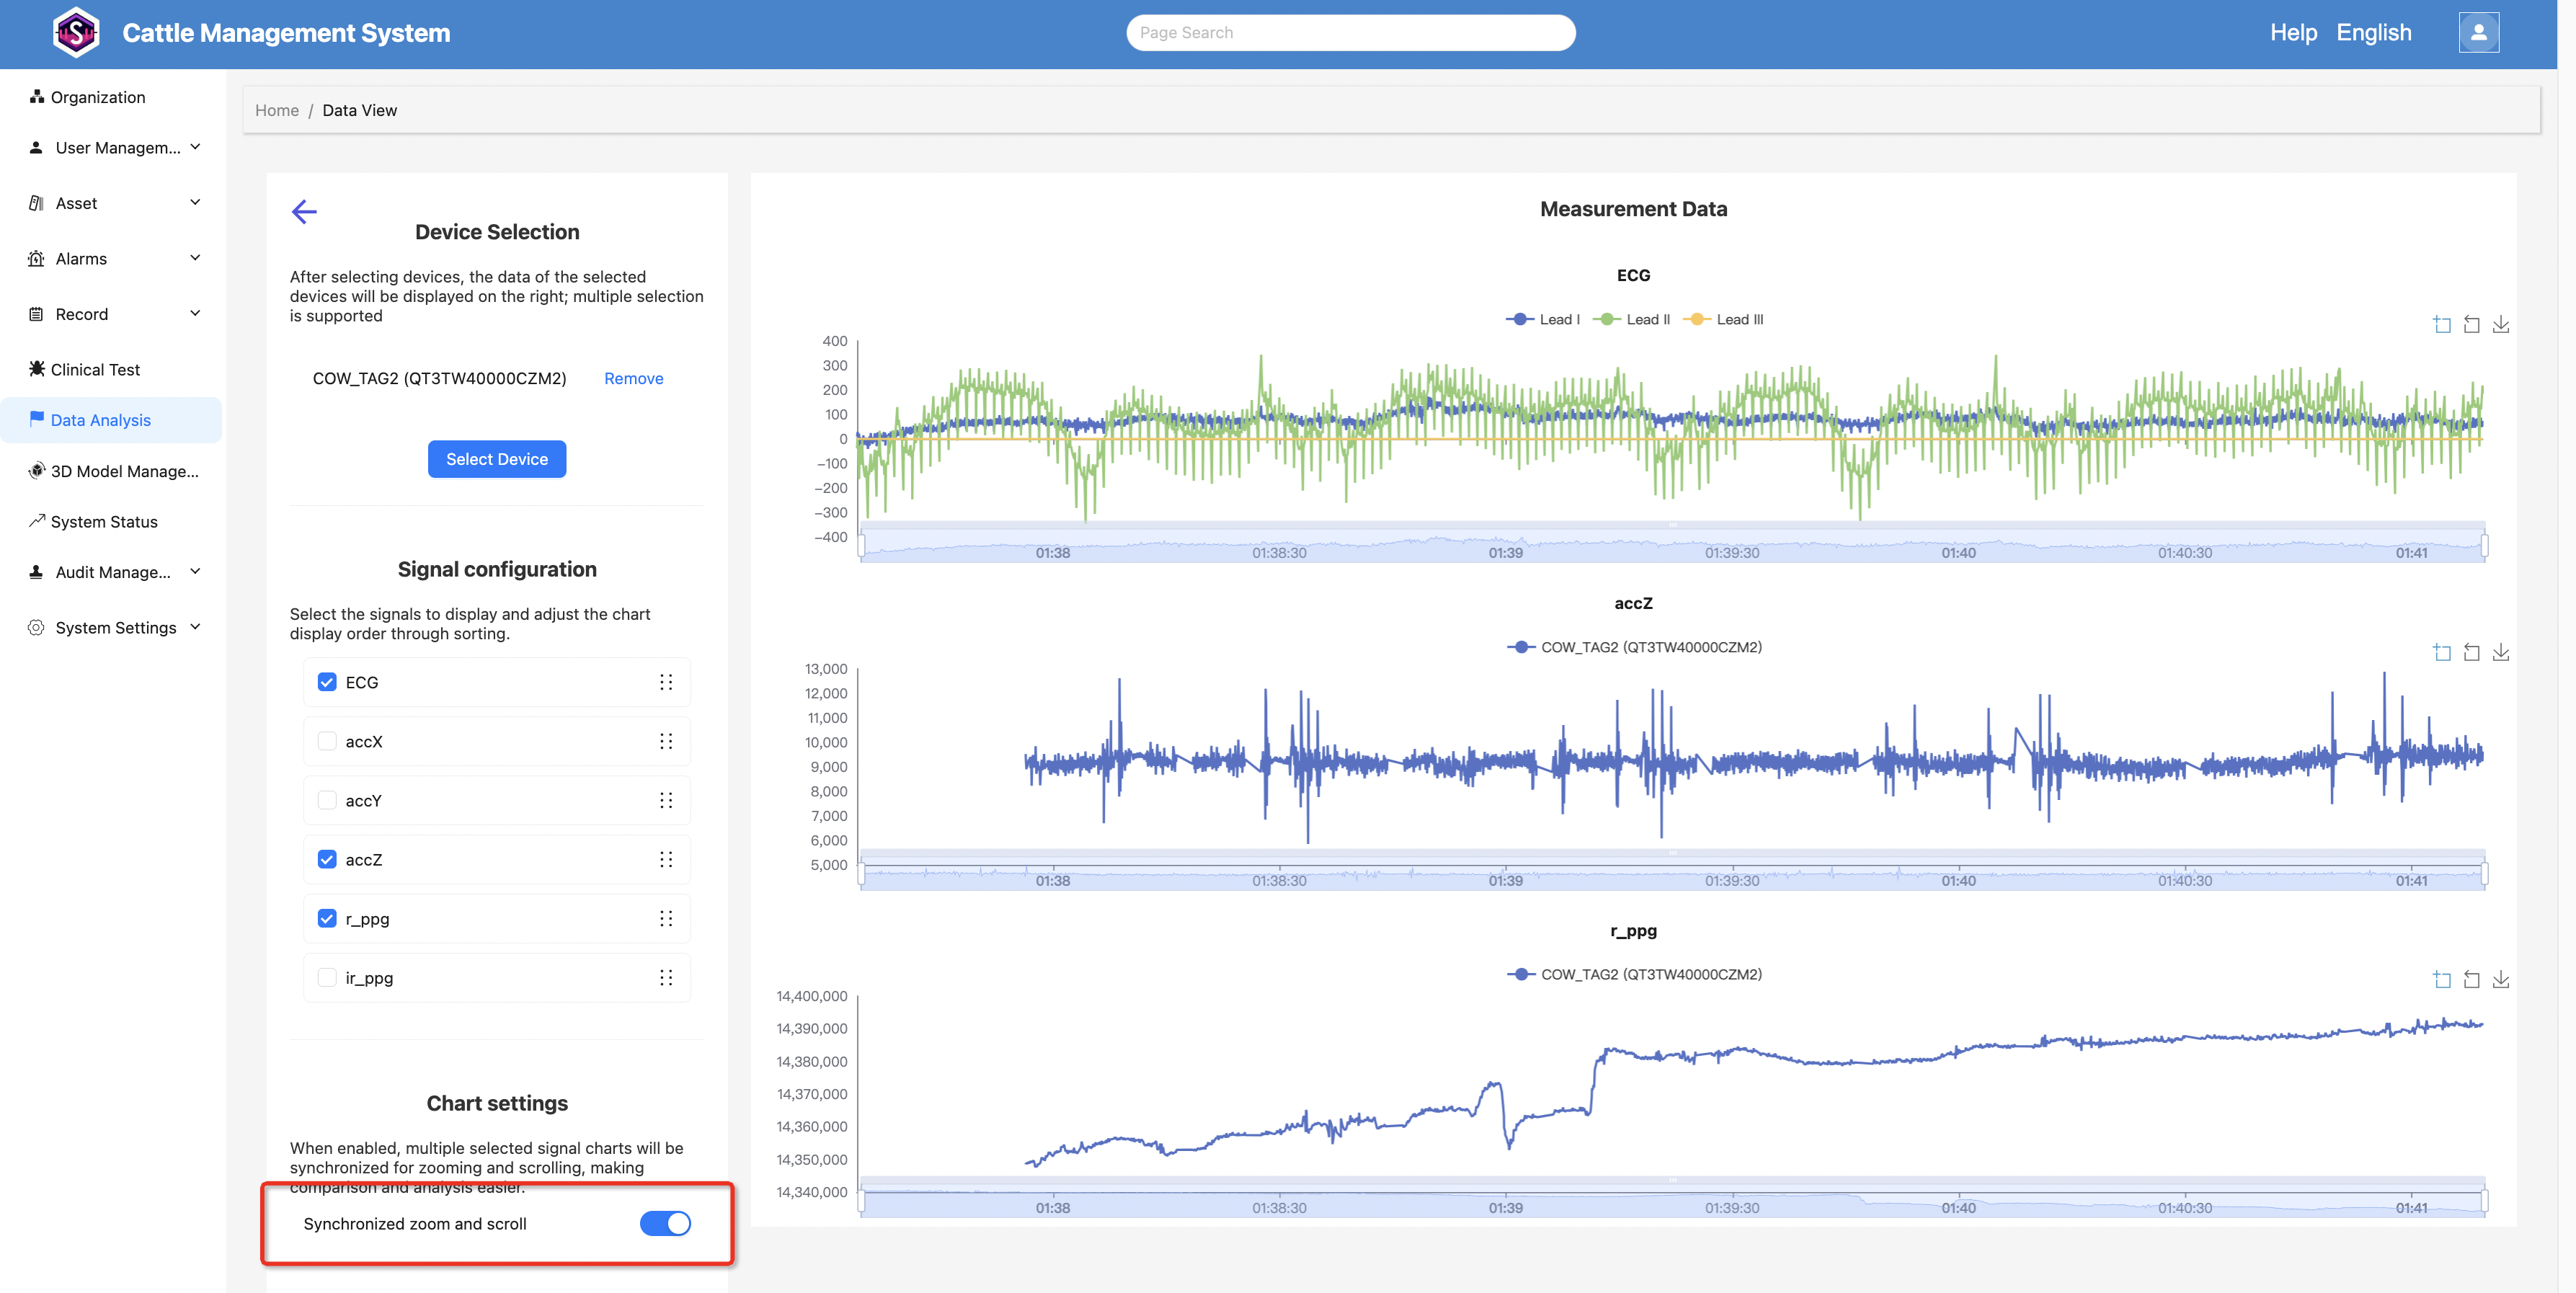
Chart Settings
You can enable or disable synchronized zooming and scroll.
When enabled, zooming or dragging any chart will automatically synchronize across all charts, making multi-device comparison easier.
Right Panel
The right panel displays line charts of the selected data.
- When signals are selected, the corresponding signal charts will be displayed
- When multiple devices are selected, each chart will contain multiple lines, with different colors representing different devices
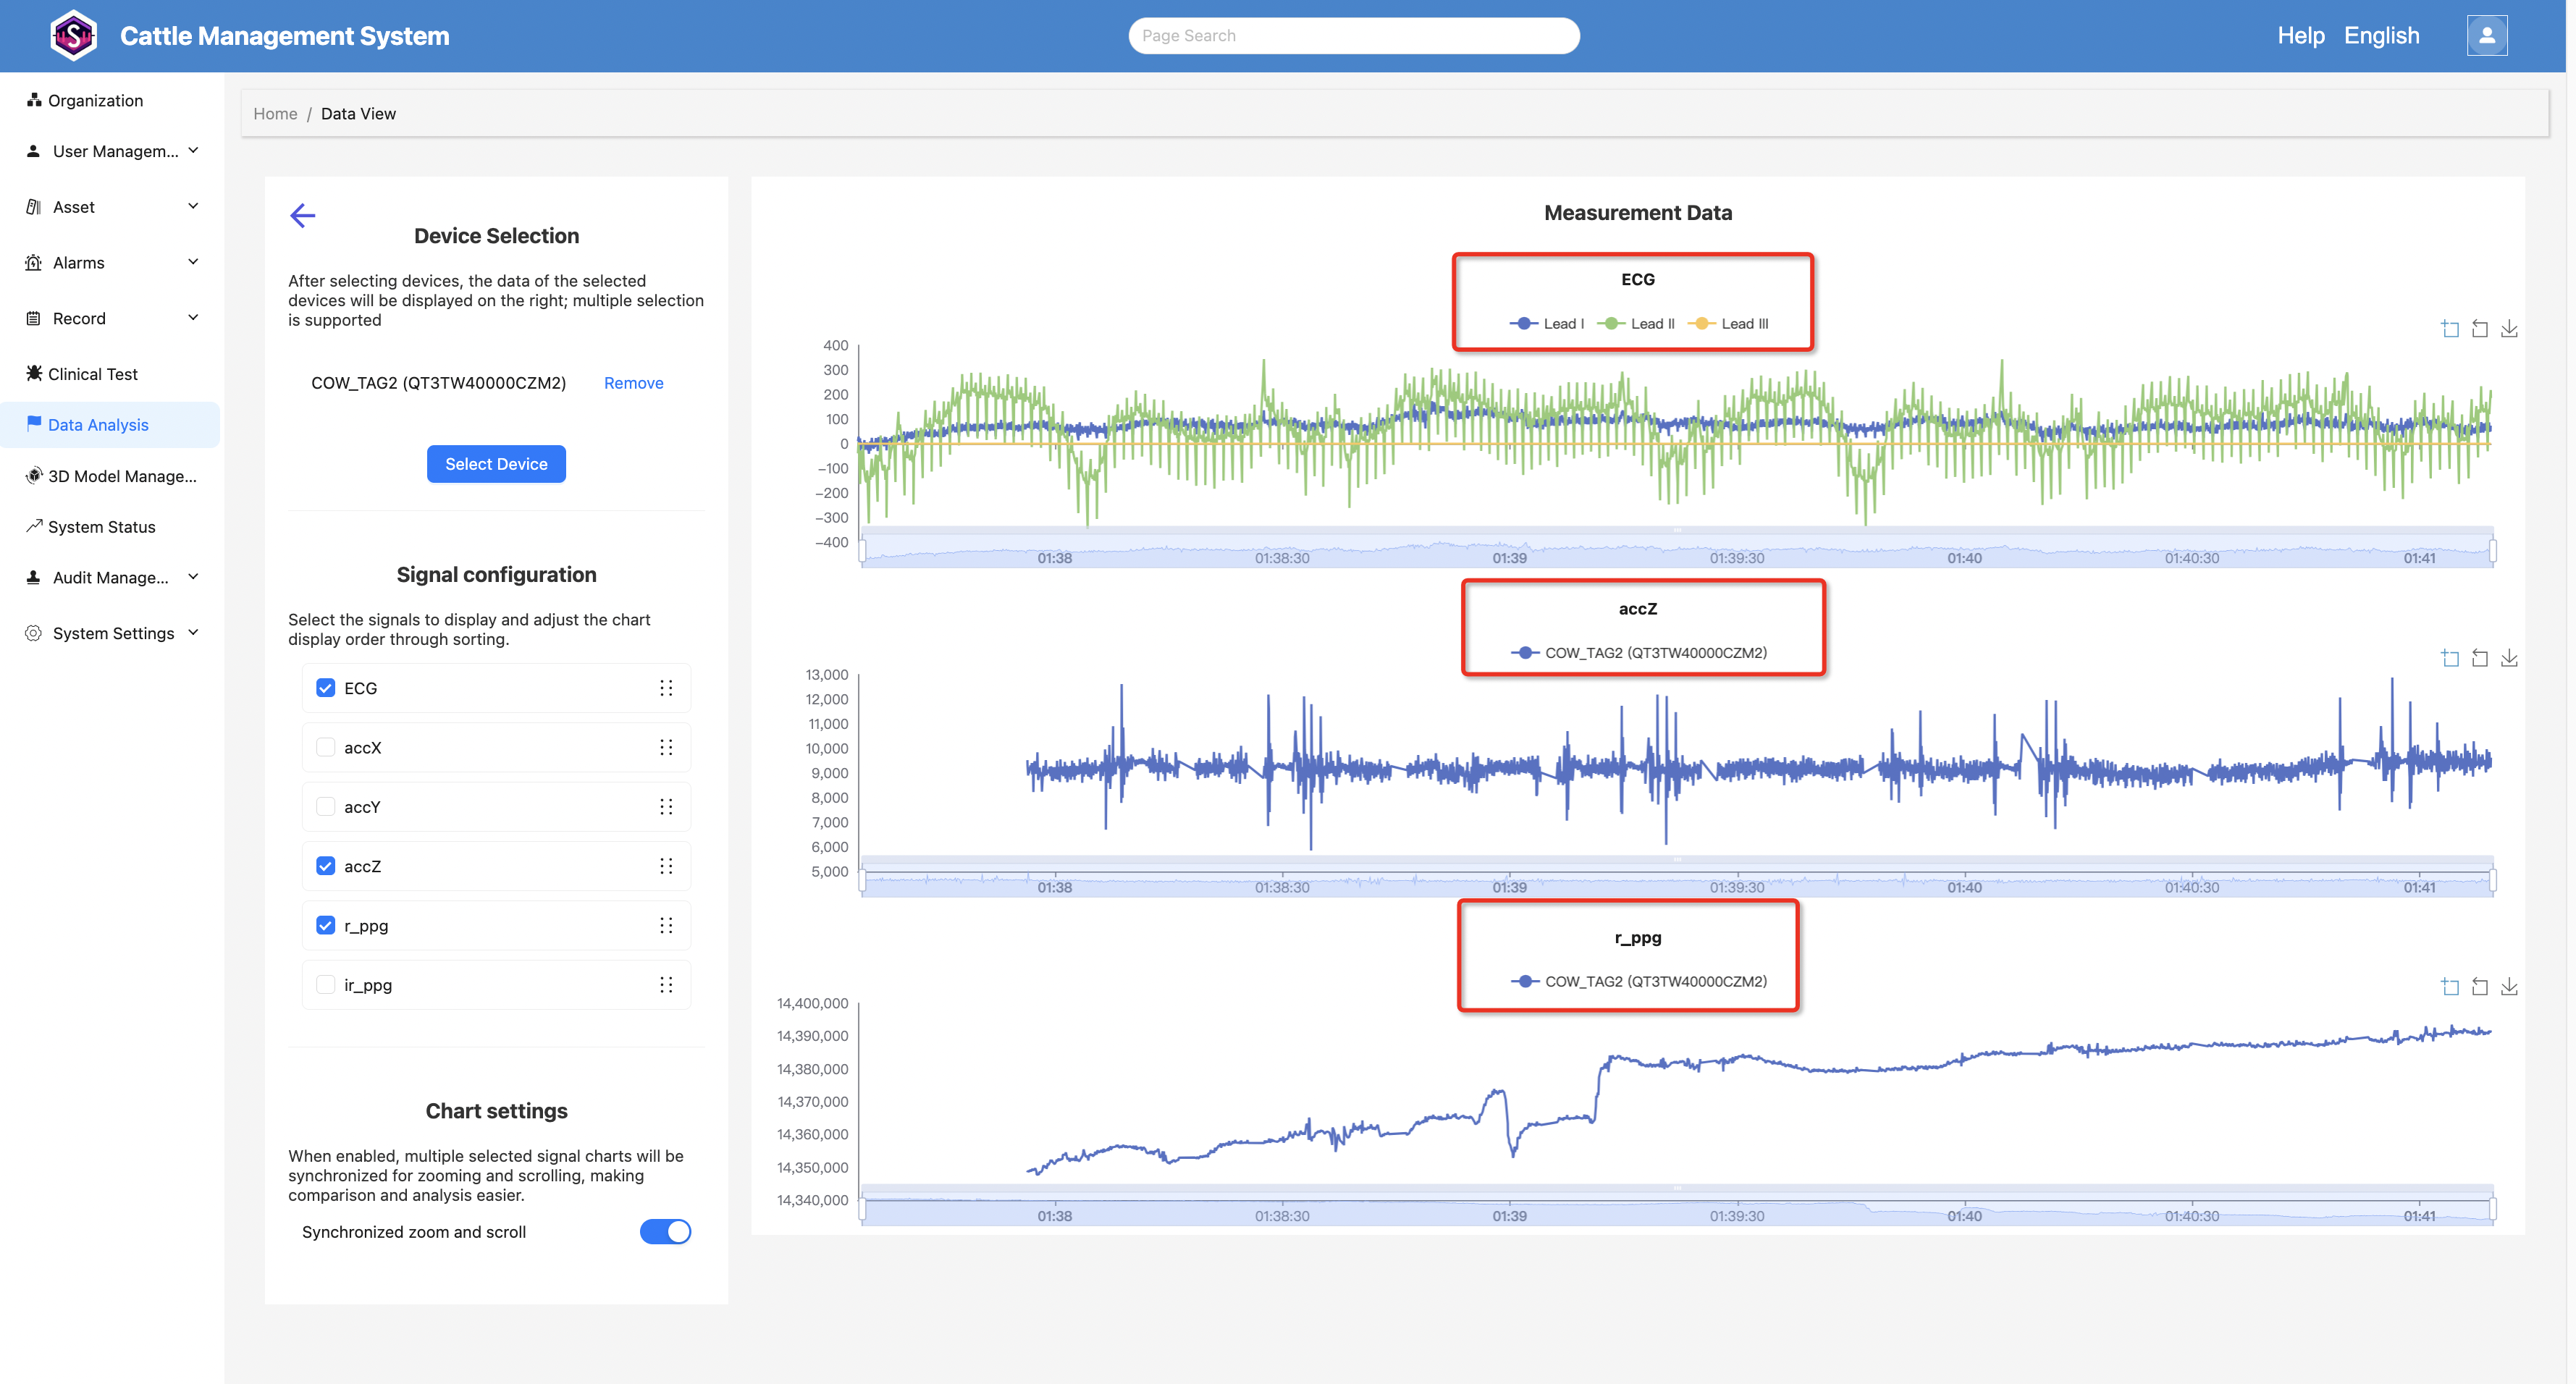
Chart Interactions
Zooming
Click and drag with the left mouse button to select an area and zoom in.
If synchronized zoom and linked panning are enabled, all other charts will follow the same operation.
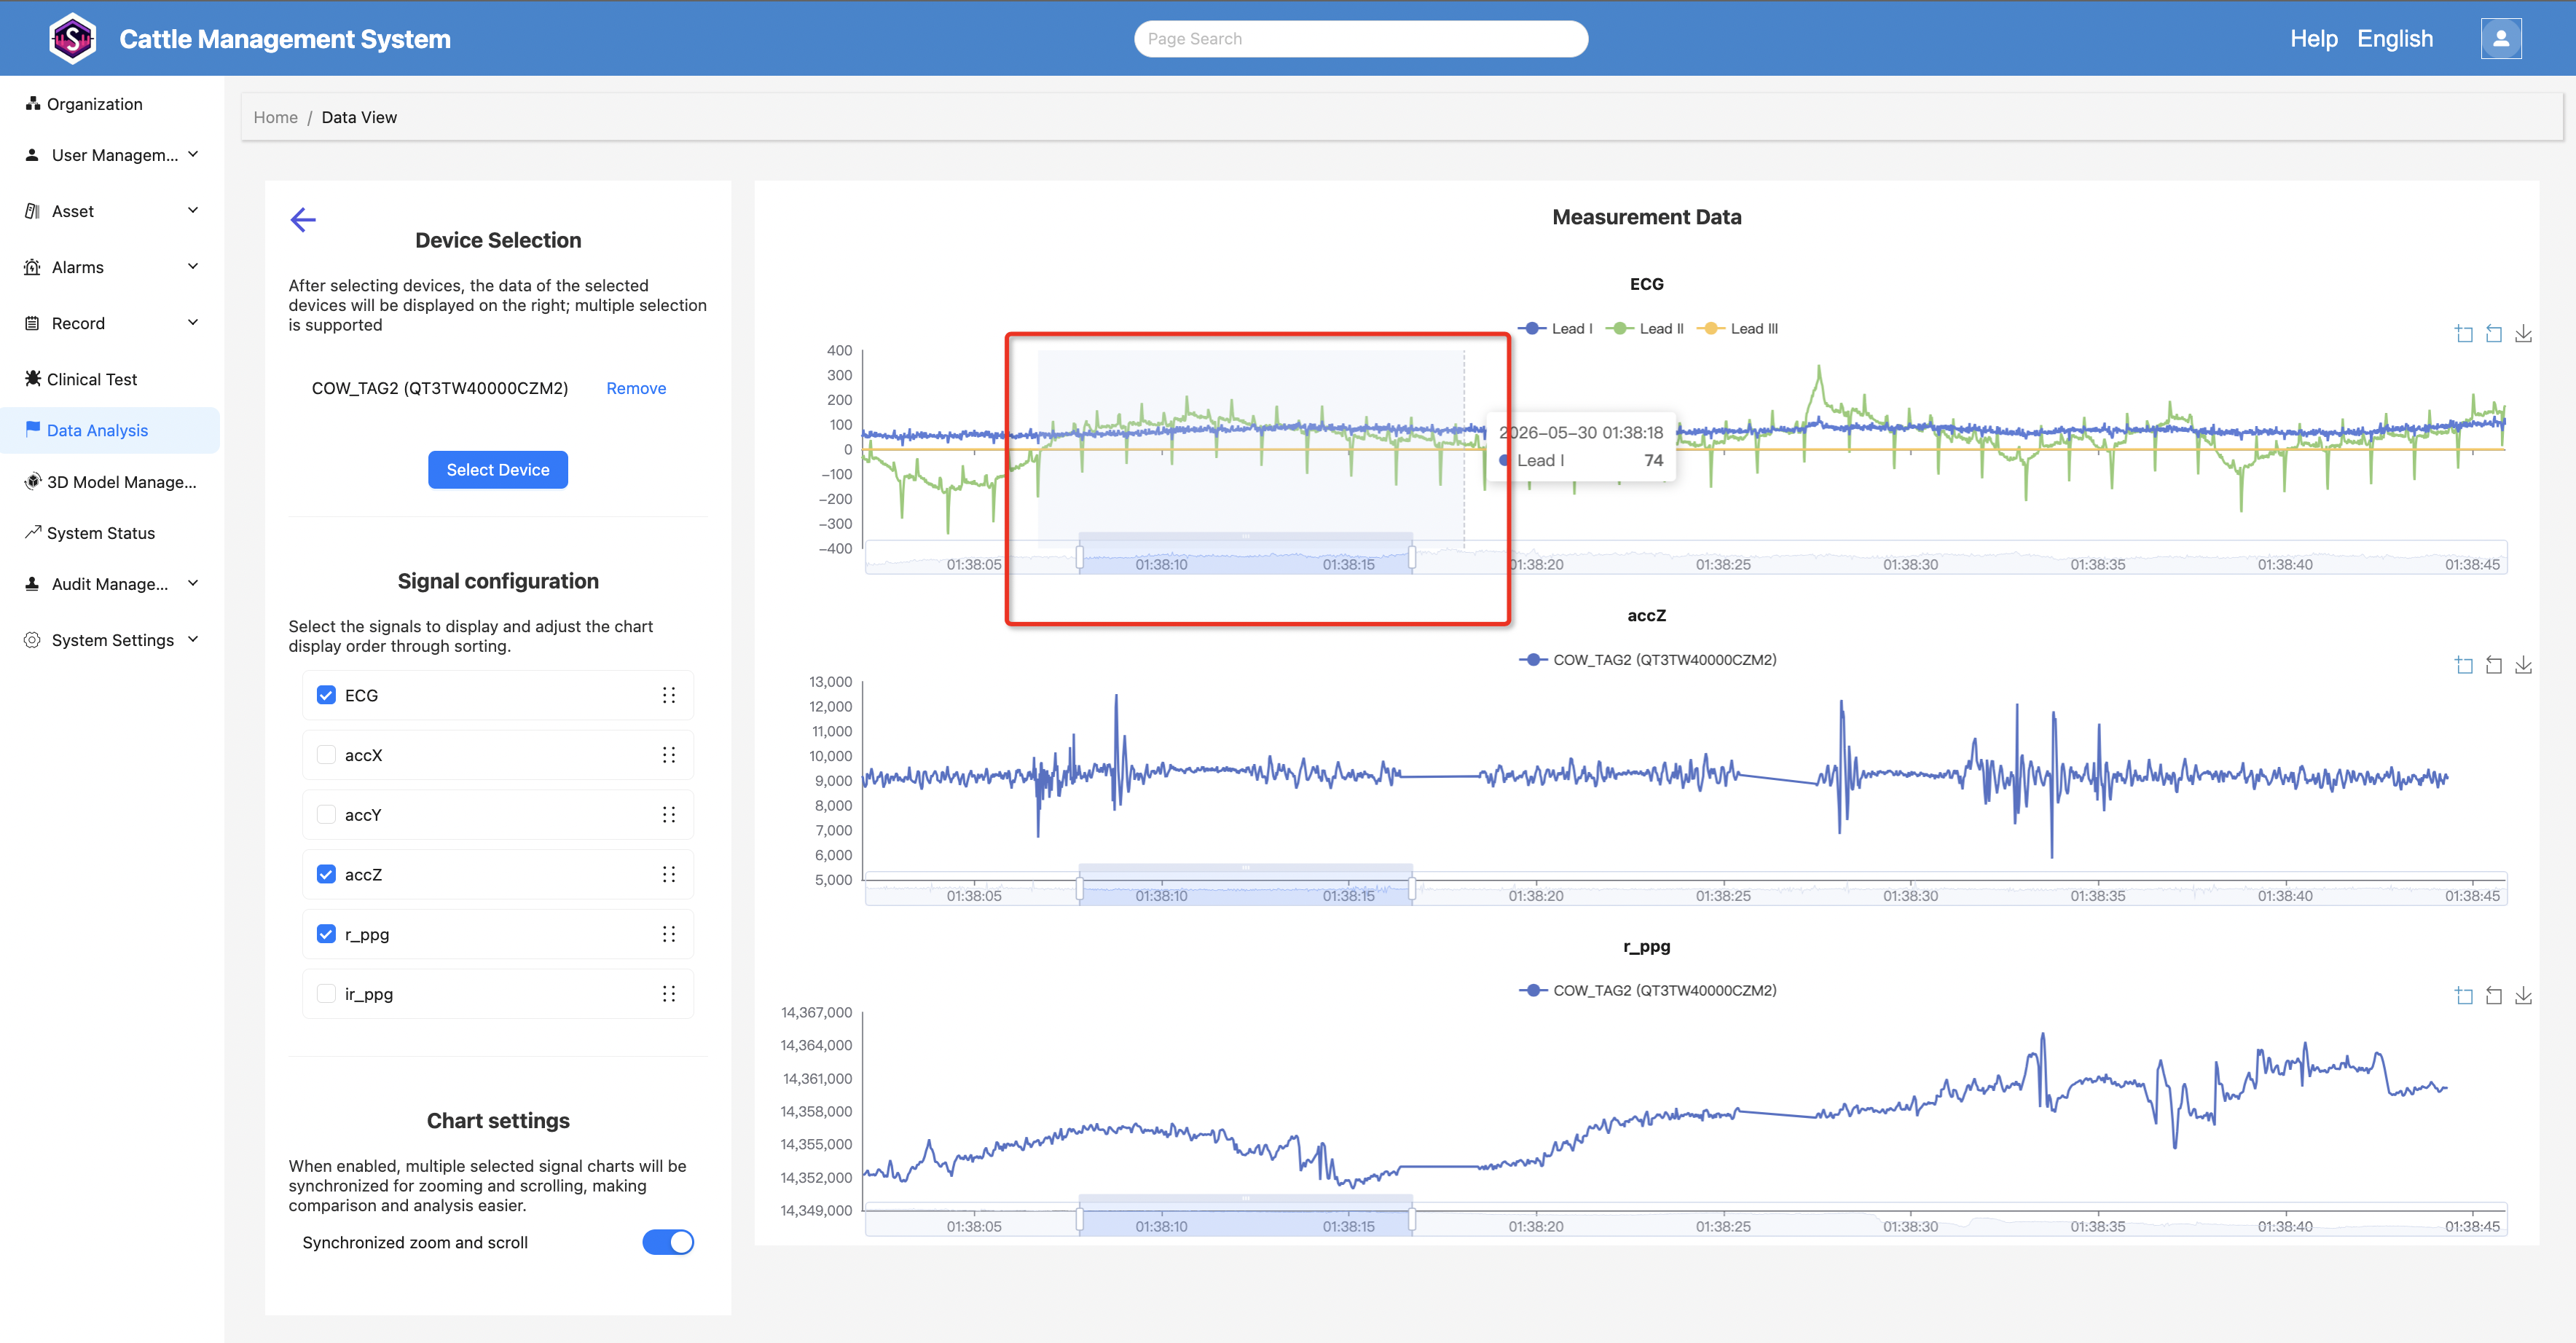
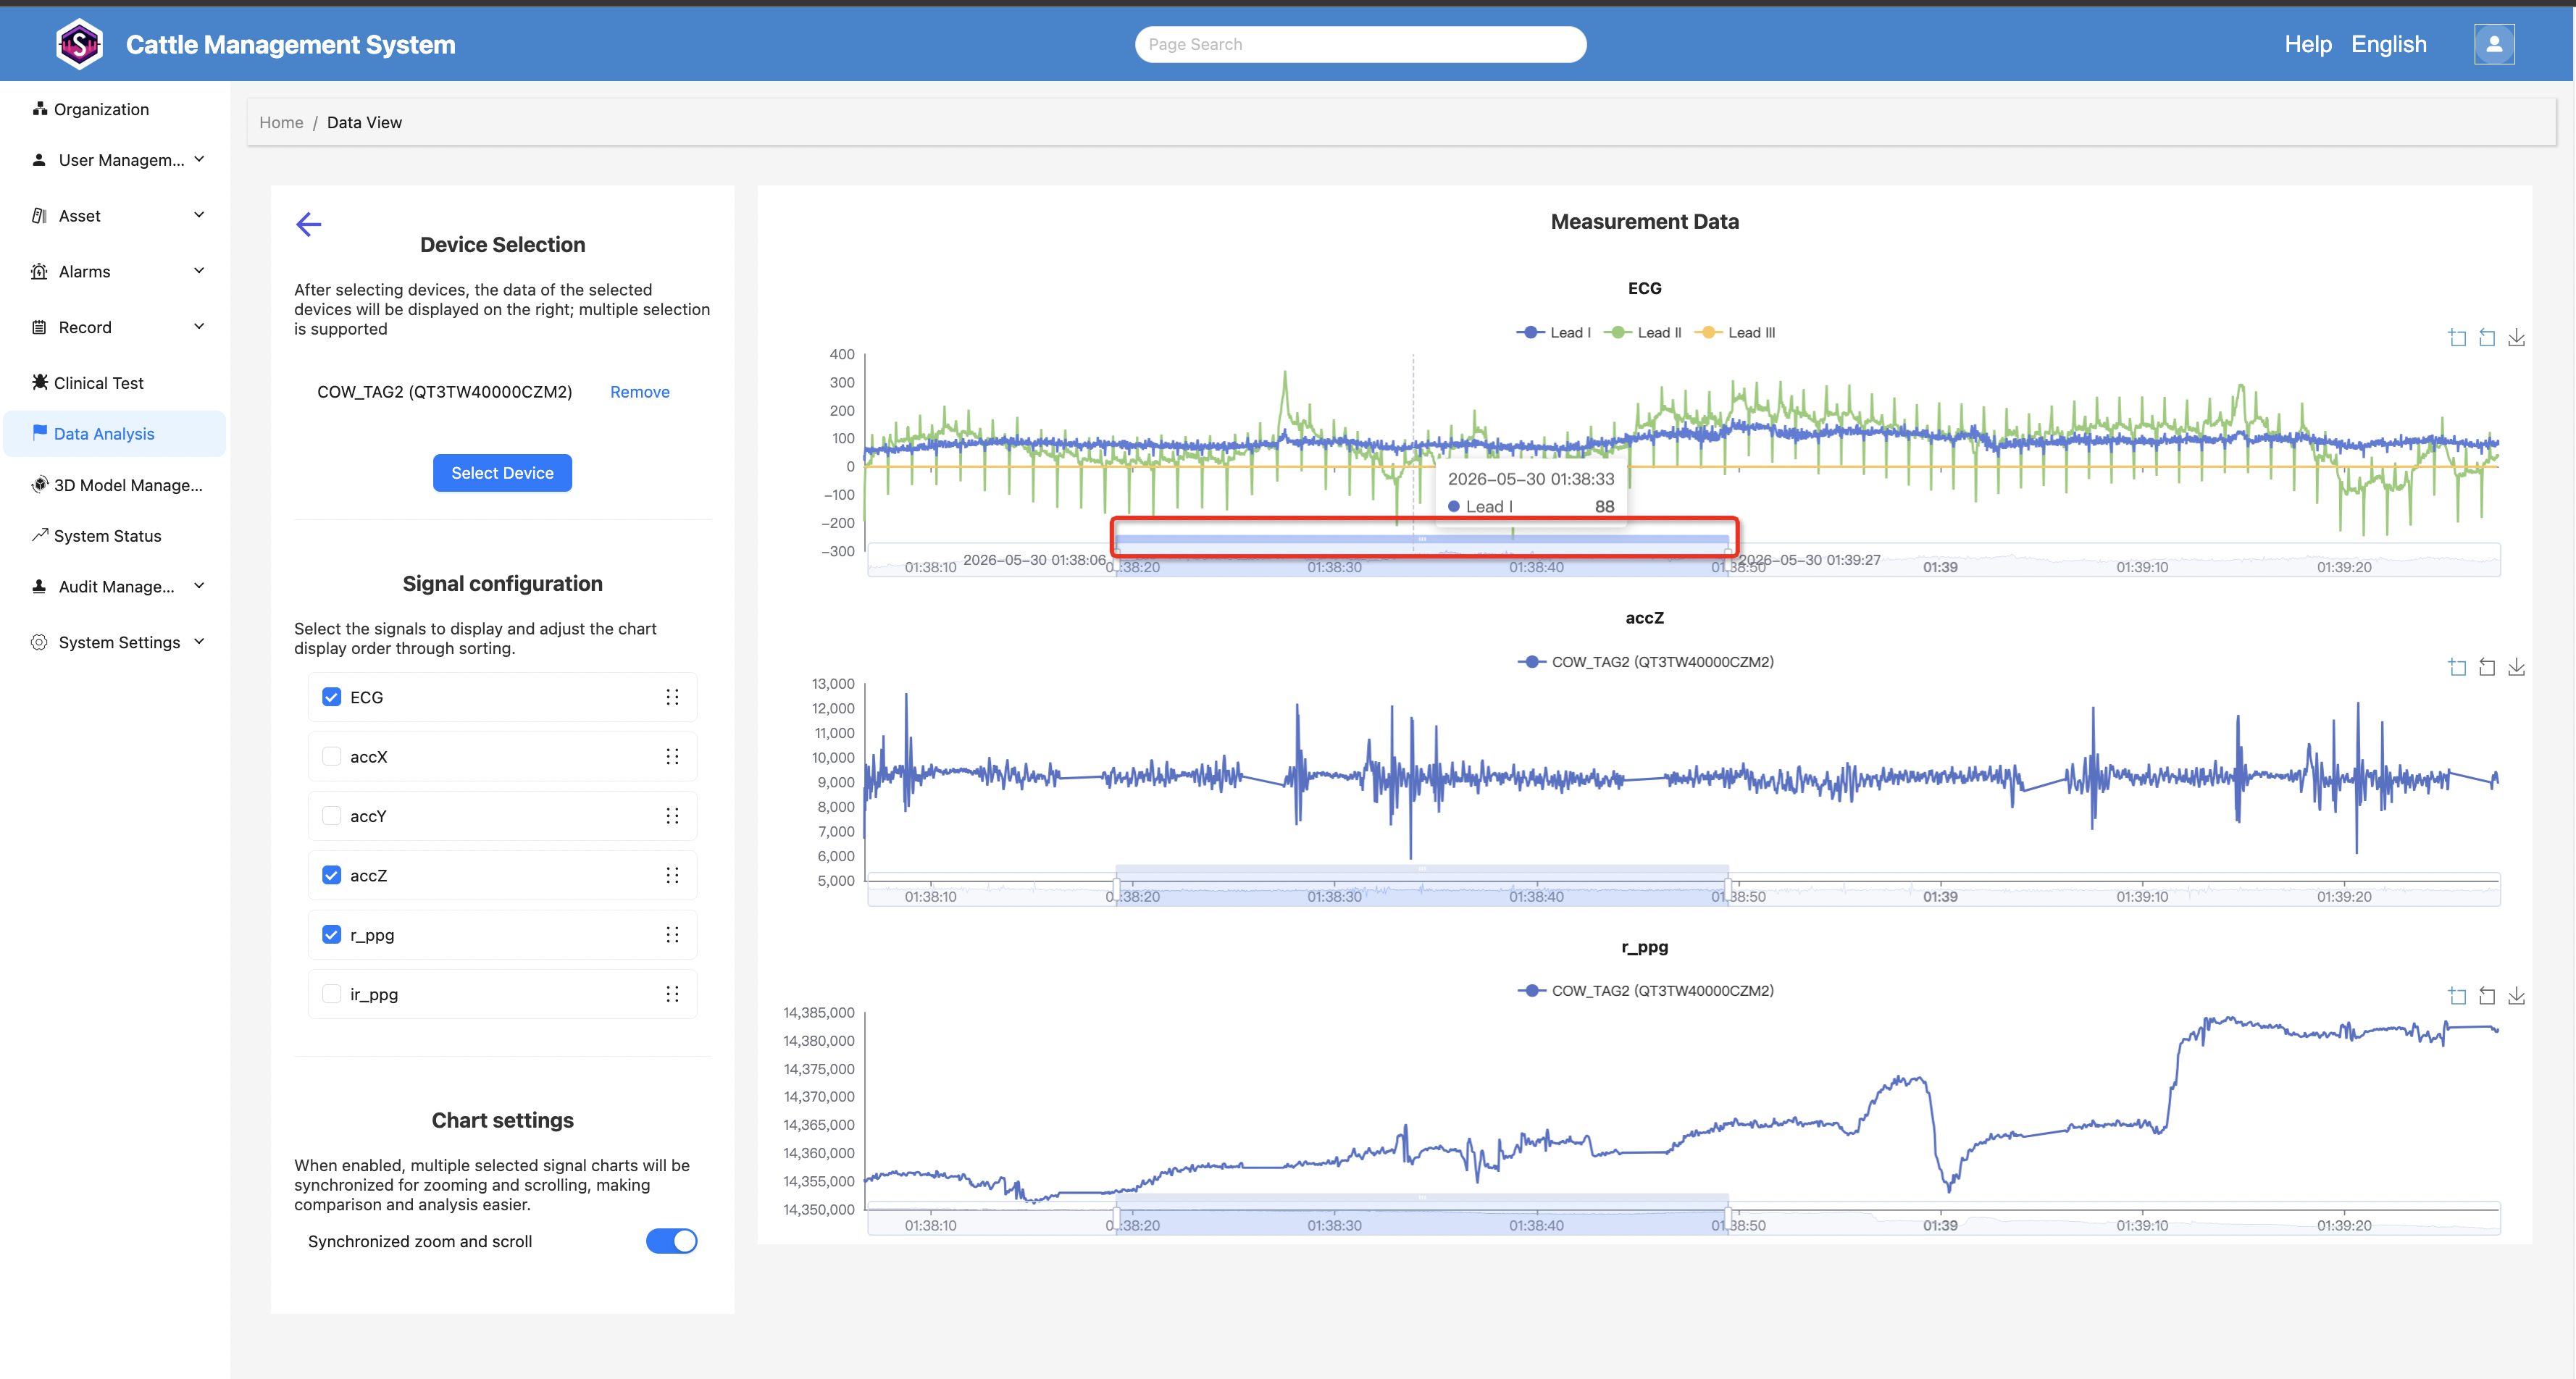
Horizontal Panning
After zooming in, you can drag the overview (navigator) at the bottom of the chart to move left or right along the time axis.
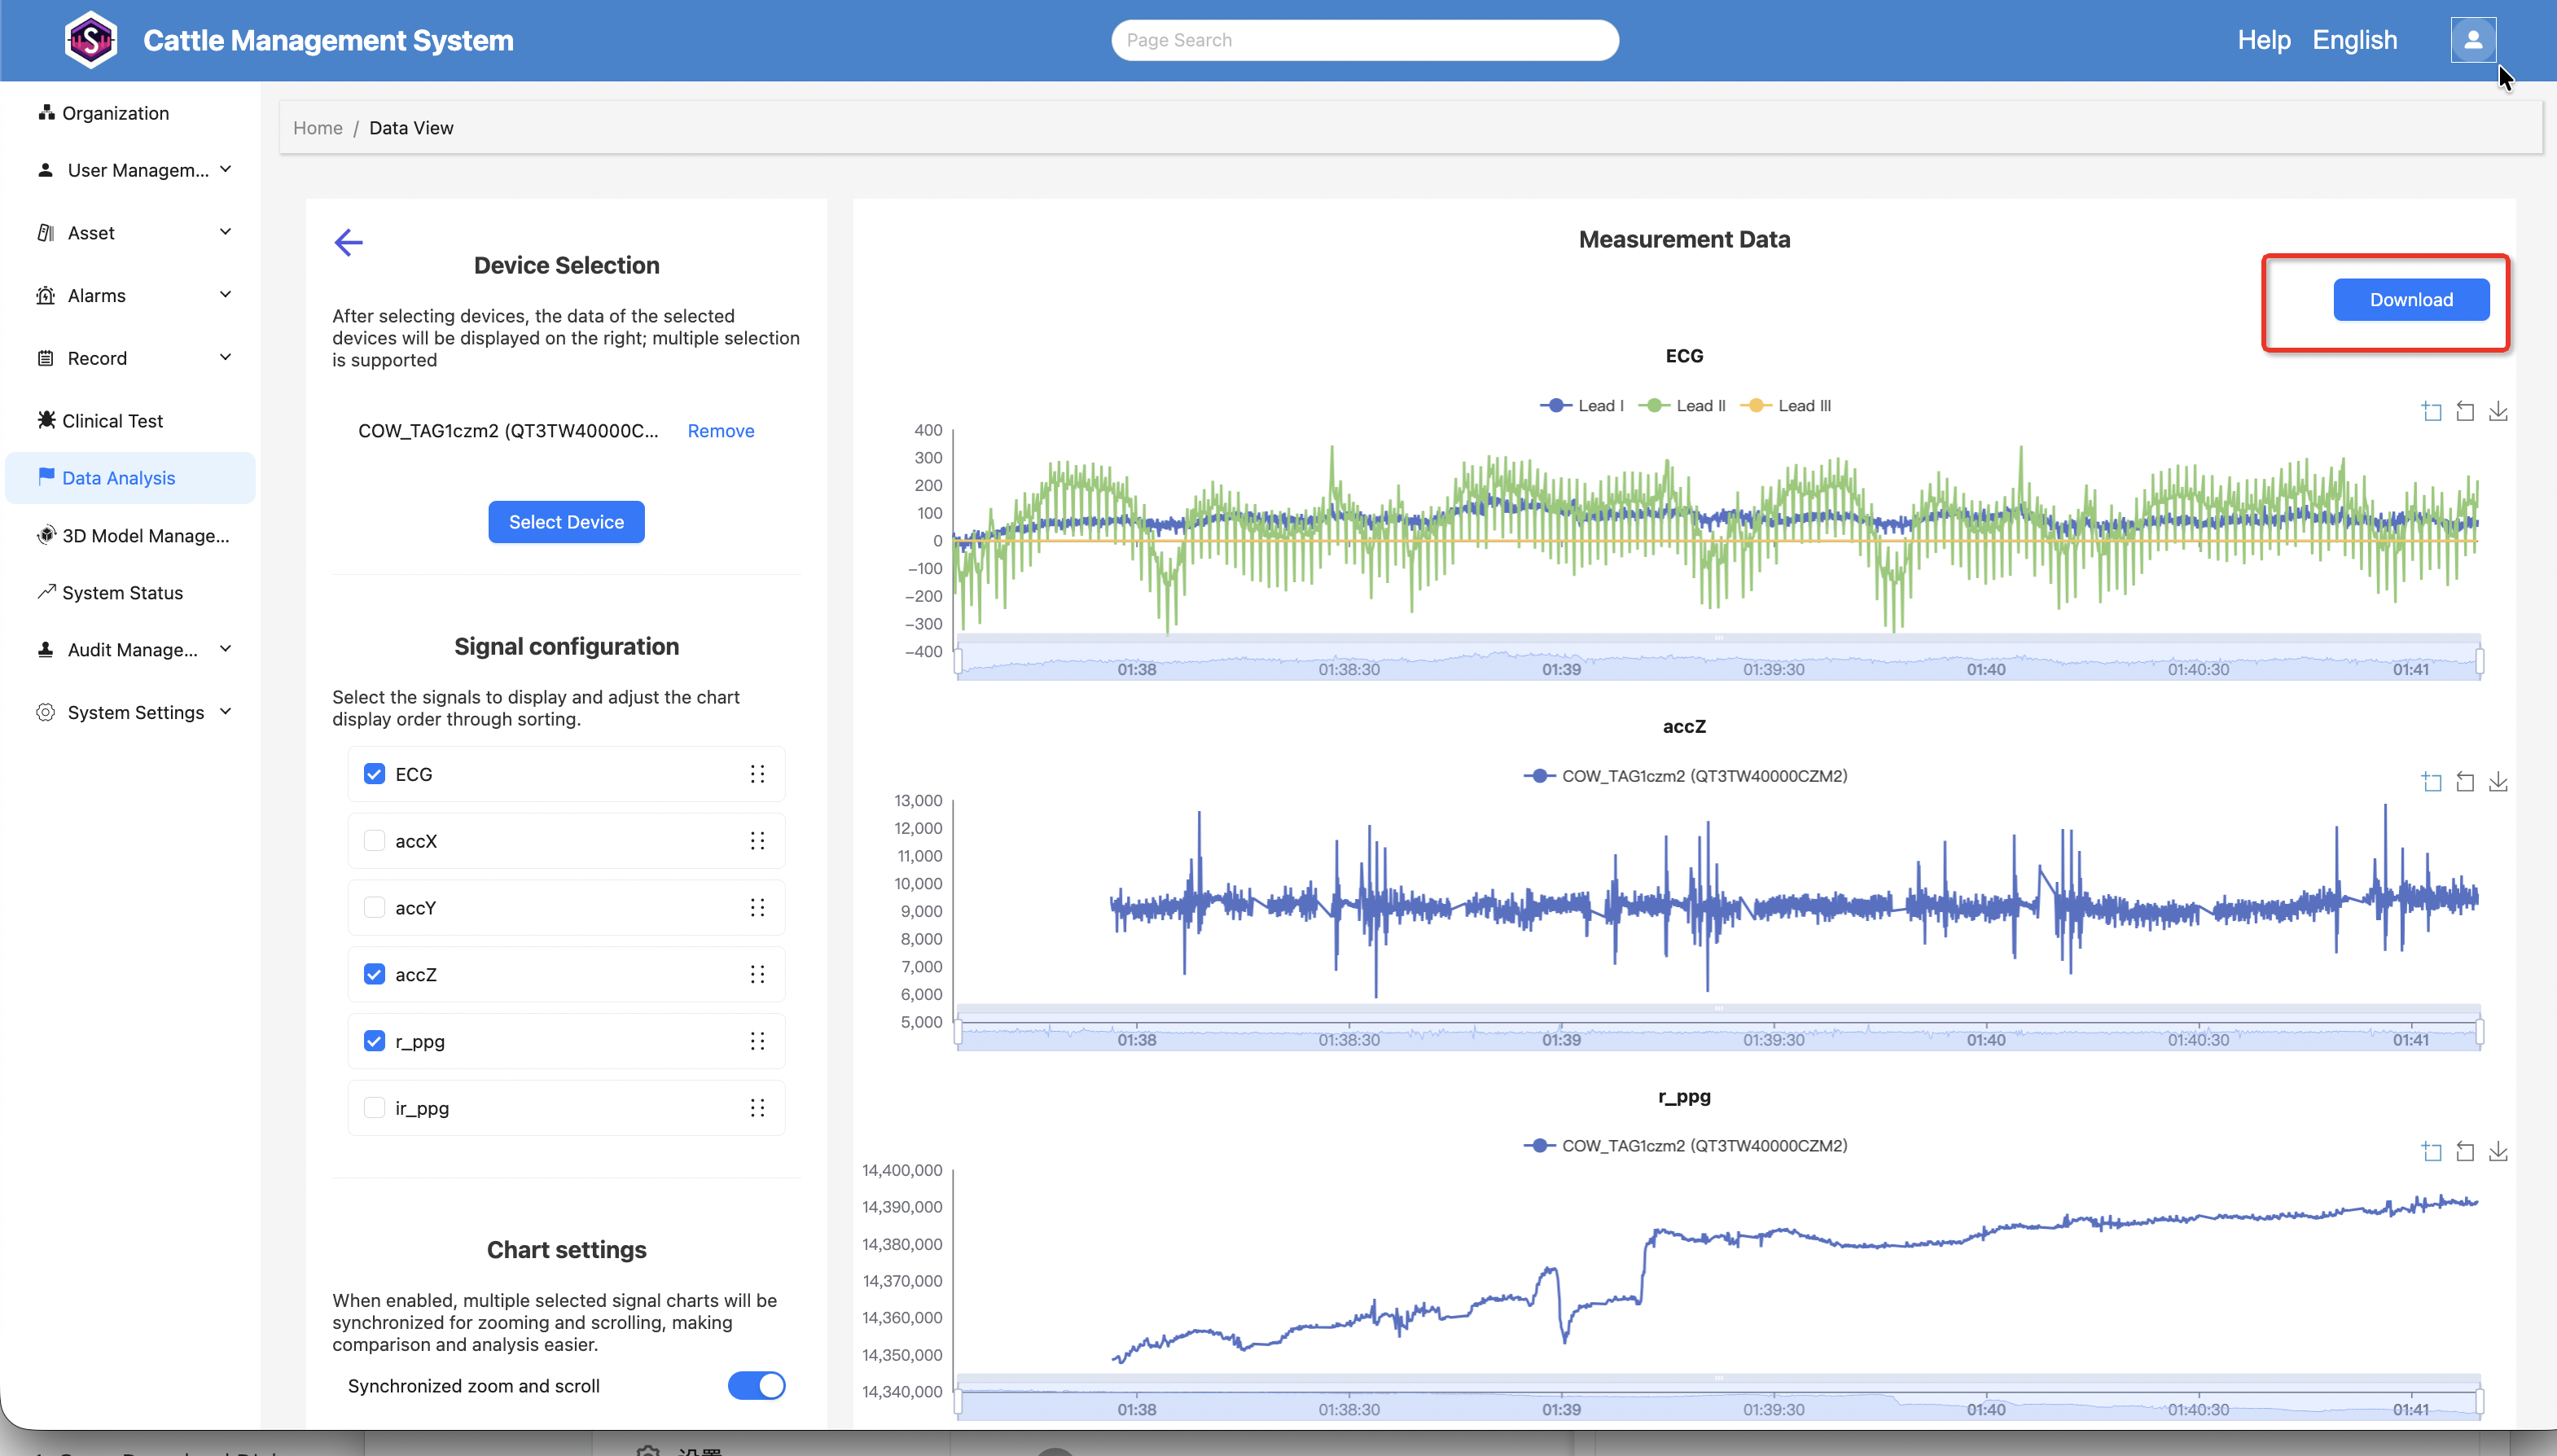
Download ECG and Ear Tag Raw Data
After selecting a device, click the "Download" button in the upper-right corner to download the ECG raw data, as well as the raw data of the selected ear-tag device corresponding to the current ECG data time range.
Download ECG and Ear Tag Raw Data
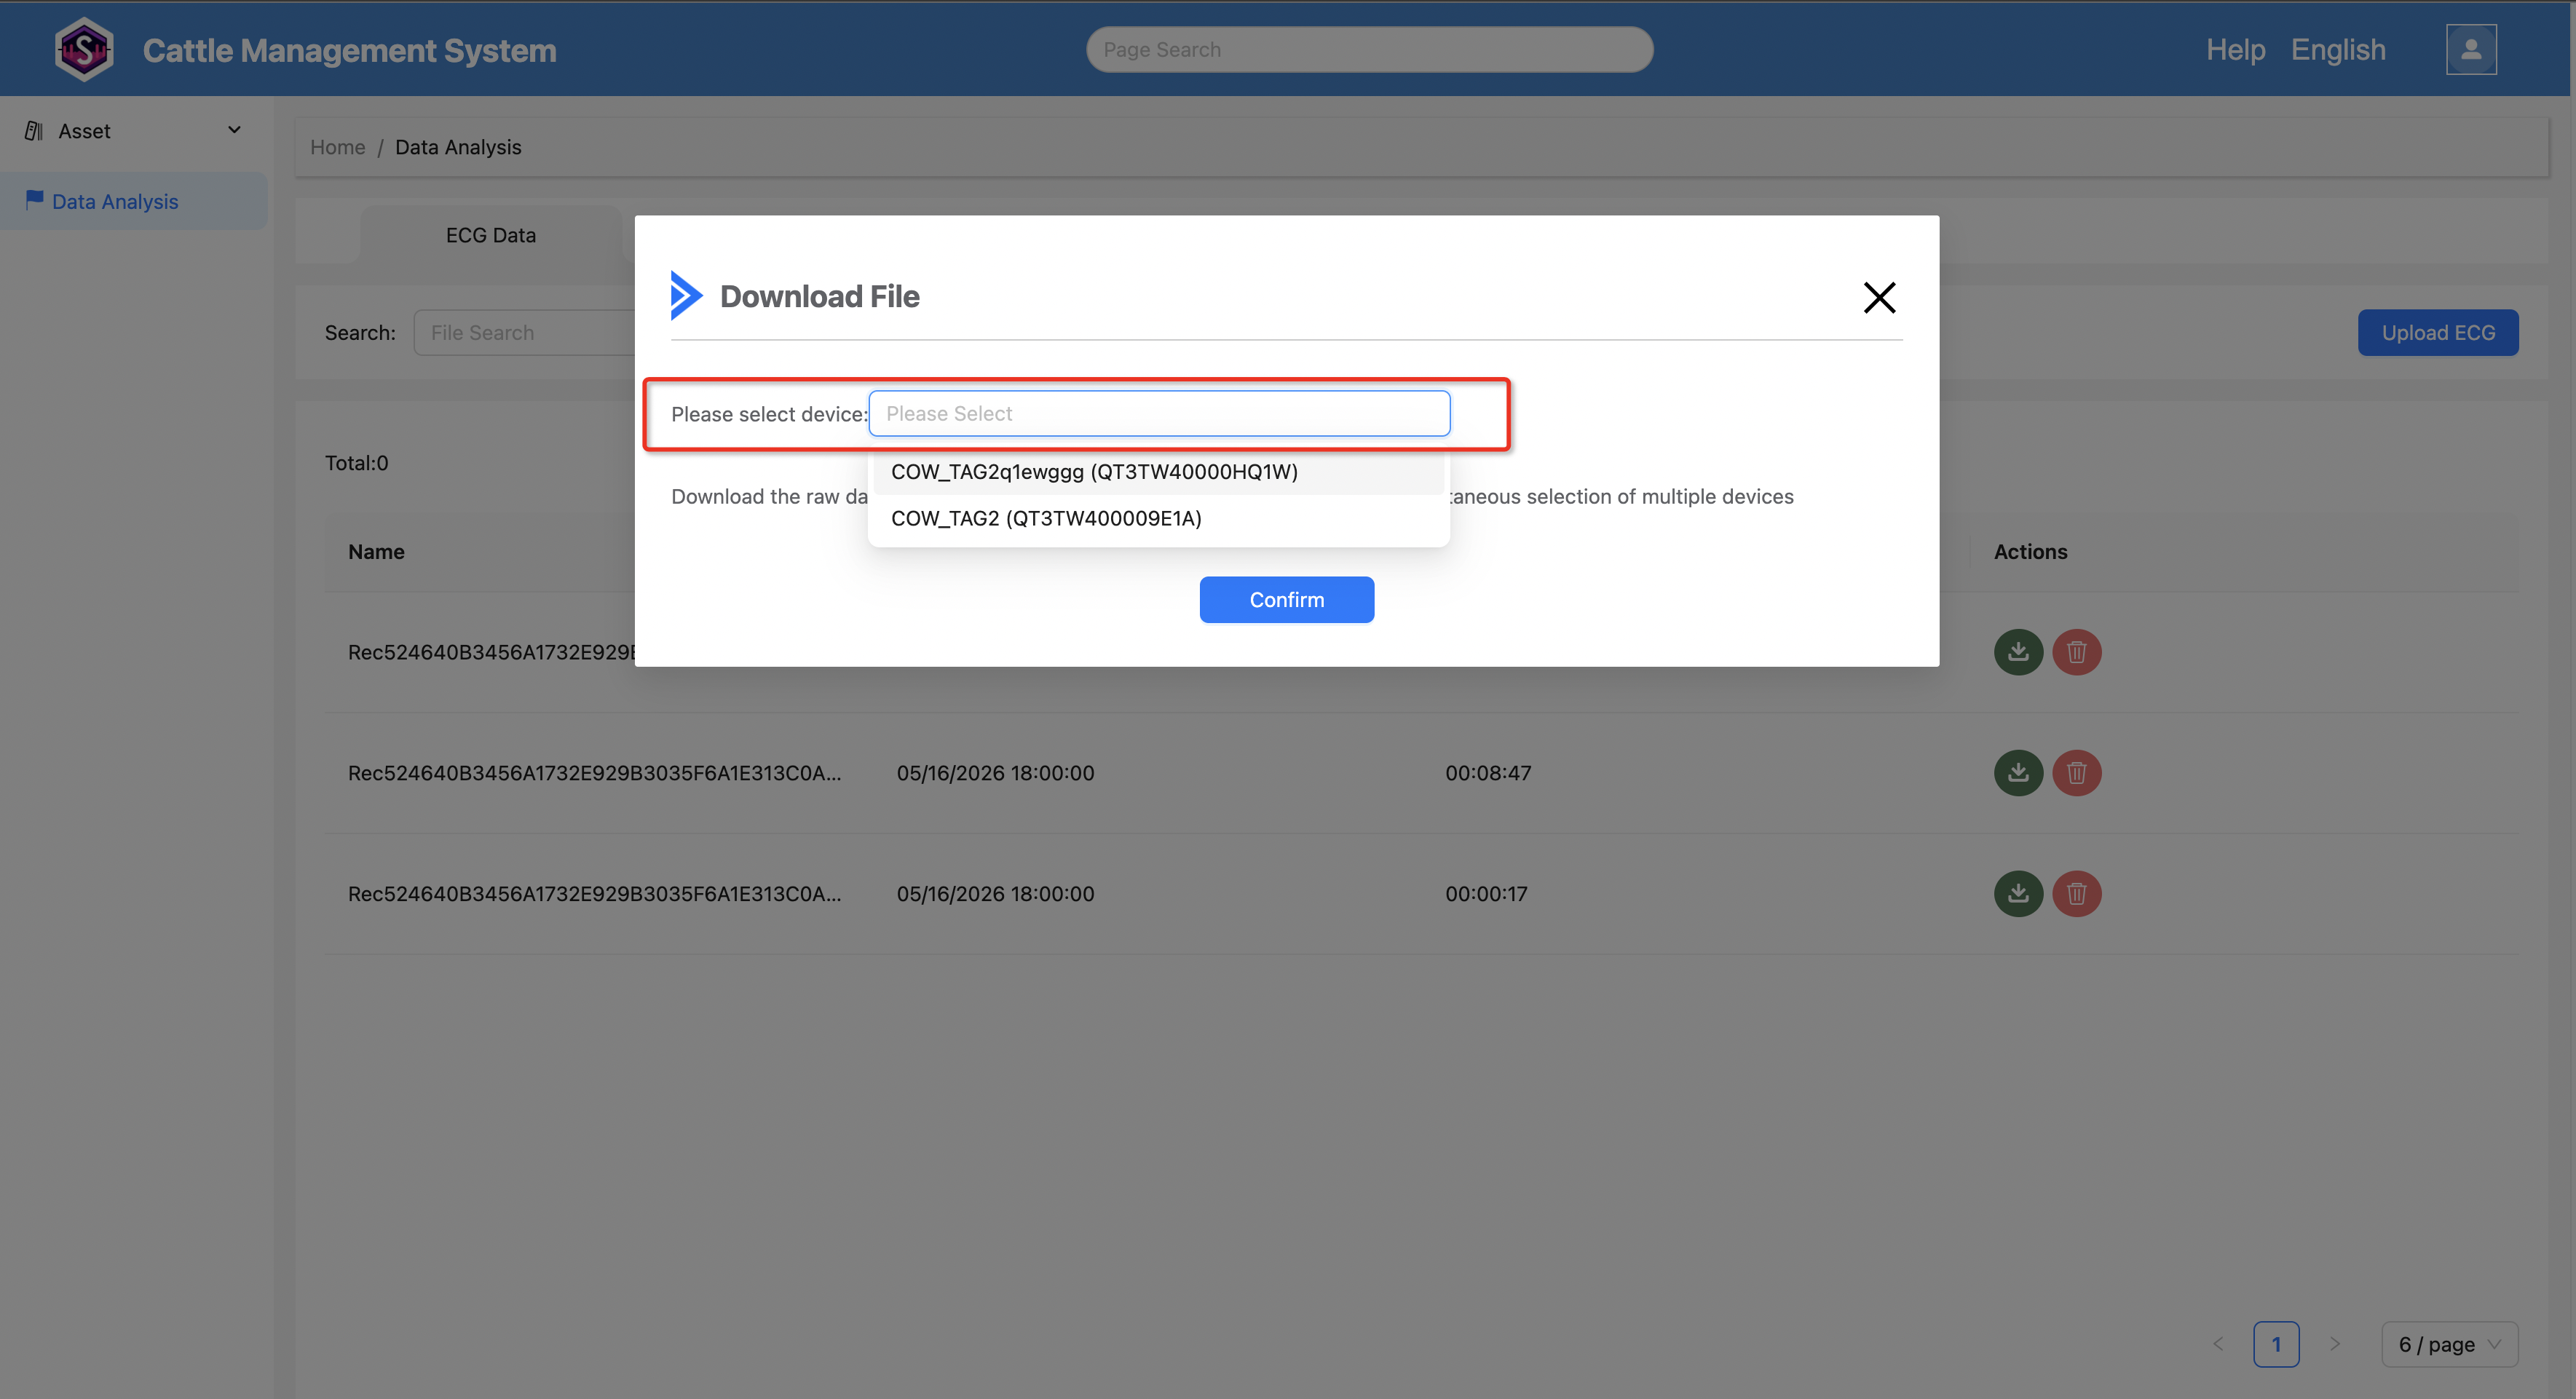
1. Open Download Dialog
In the ECG list, click the Download icon to open the download dialog.
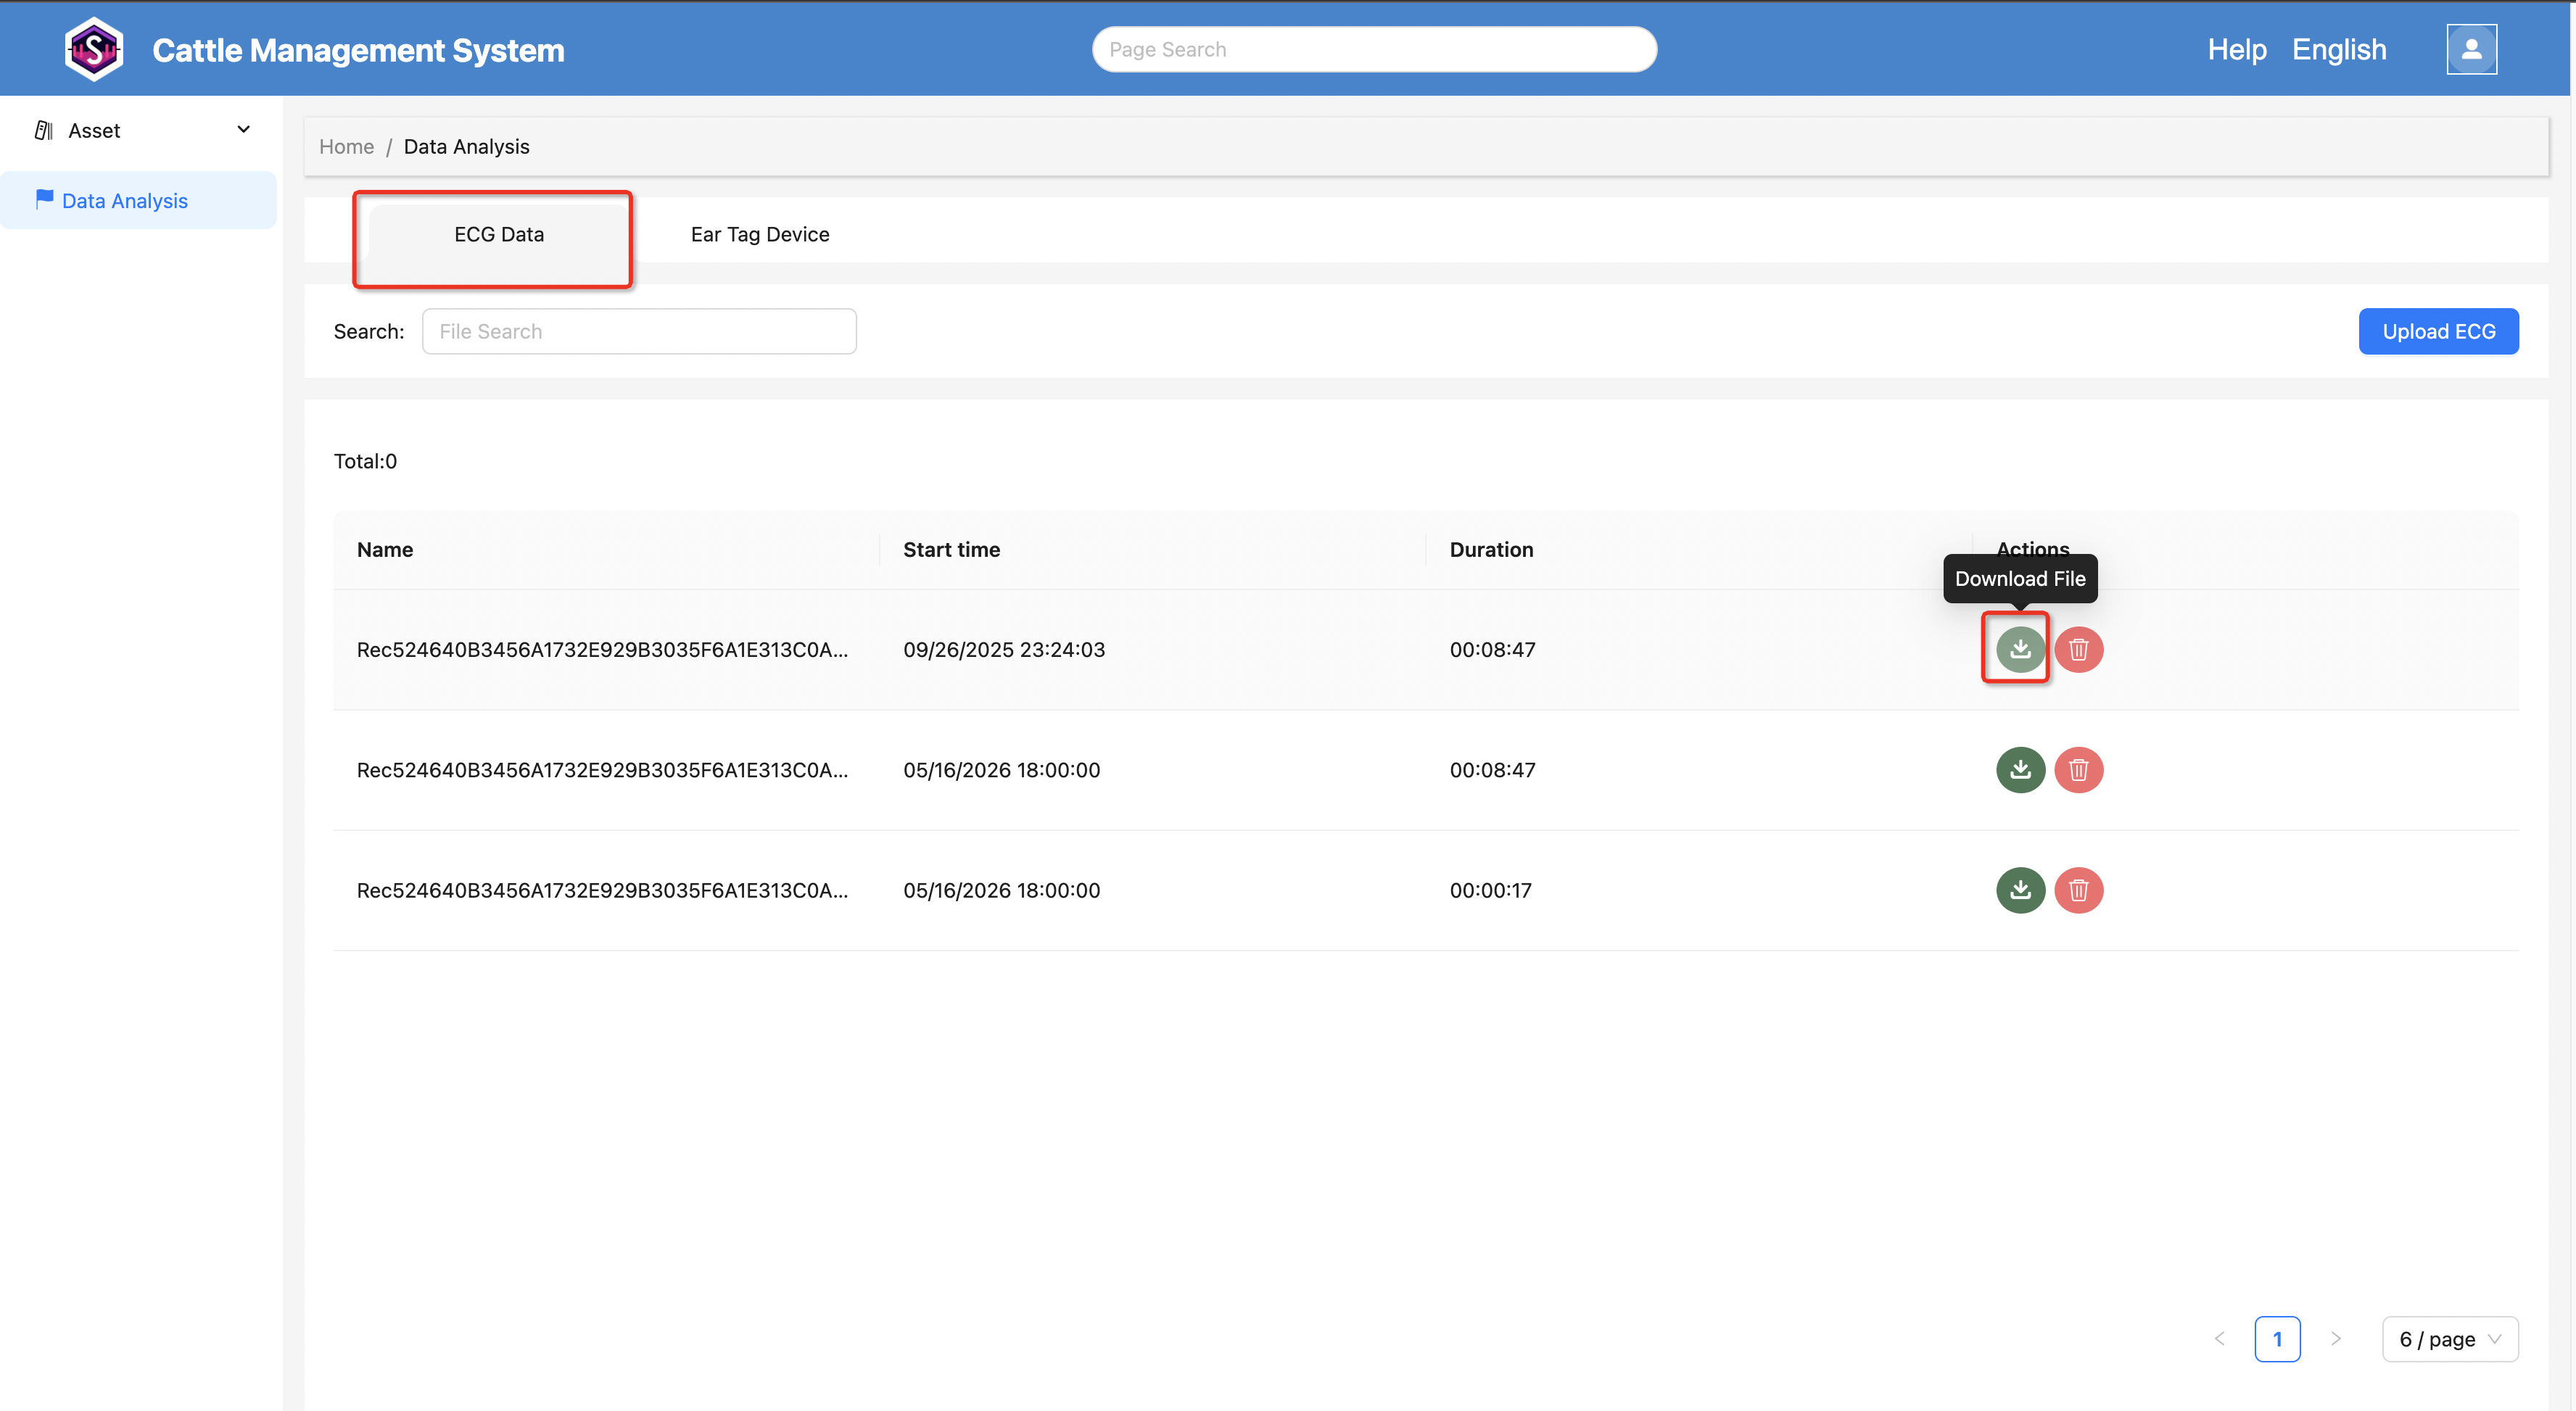
2. Download Data
The dialog supports:
- Selecting multiple devices
- Downloading ECG data
- Downloading raw ear tag data from the same time period as the ECG data